-
-

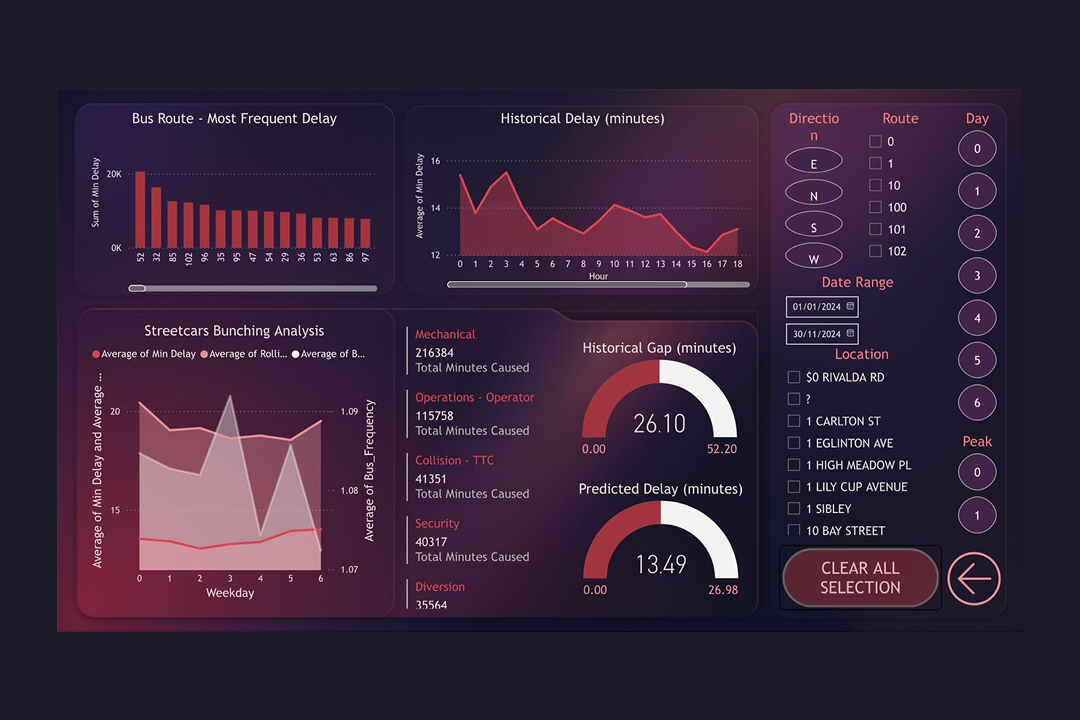
Bus Analytics
-
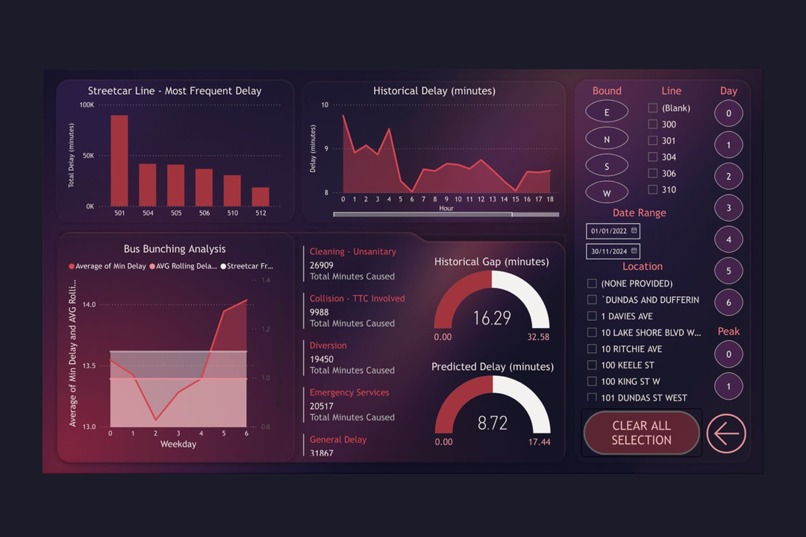
Streetcar Analytics
-
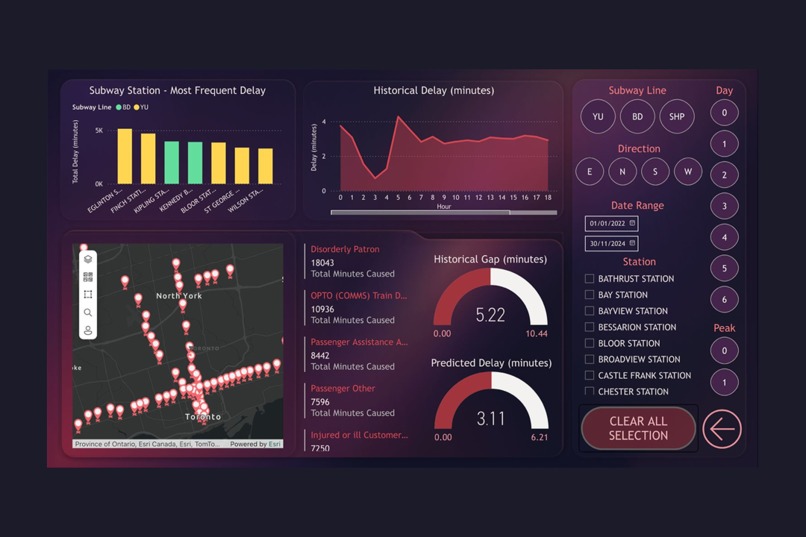
Subway Analytics


Inspiration
As Toronto residents, we frequently experience delays in trains, buses, and streetcars, disrupting everything from personal plans to school and work. Experiencing frequent delays in public transit has often made us late for various activities, sparking our curiosity about the reasons behind these disruptions and the areas where they occur most frequently.
What it does
Our project aims to analyze historical data through different filtered selections and predict future delays.
How we built it
Heavy data cleaning, imputation, statistical testing, and modelling in Python. The final dataset with predictive analysis is extracted to PowerBI for dynamic dashboard/analytics.
Challenges we ran into
The biggest challenge we ran into was the 1-day time frame for a huge impactful project.
Accomplishments that we're proud of
Our proudest accomplishment is the Power BI dashboard, which is not only highly functional but also thoughtfully designed to reflect the TTC’s brand identity. We incorporated red as the primary accent colour and aligned chart values with the corresponding subway line colours for a cohesive and visually intuitive user experience.
What we learned
The prediction we've obtained reveals how the TTC is generally late, with the least late starting from the subway, then streetcars, and then the bus.
What's next for 5W+1H Am I Late?
In the future, we plan to integrate analysis with better time-series statistics and use more geospatial data to potentially predict real-time delays.
Built With
- powerbi
- python


Log in or sign up for Devpost to join the conversation.