-
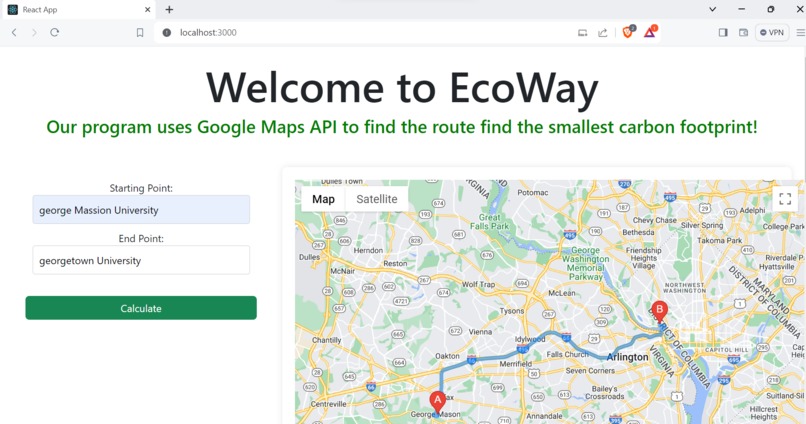
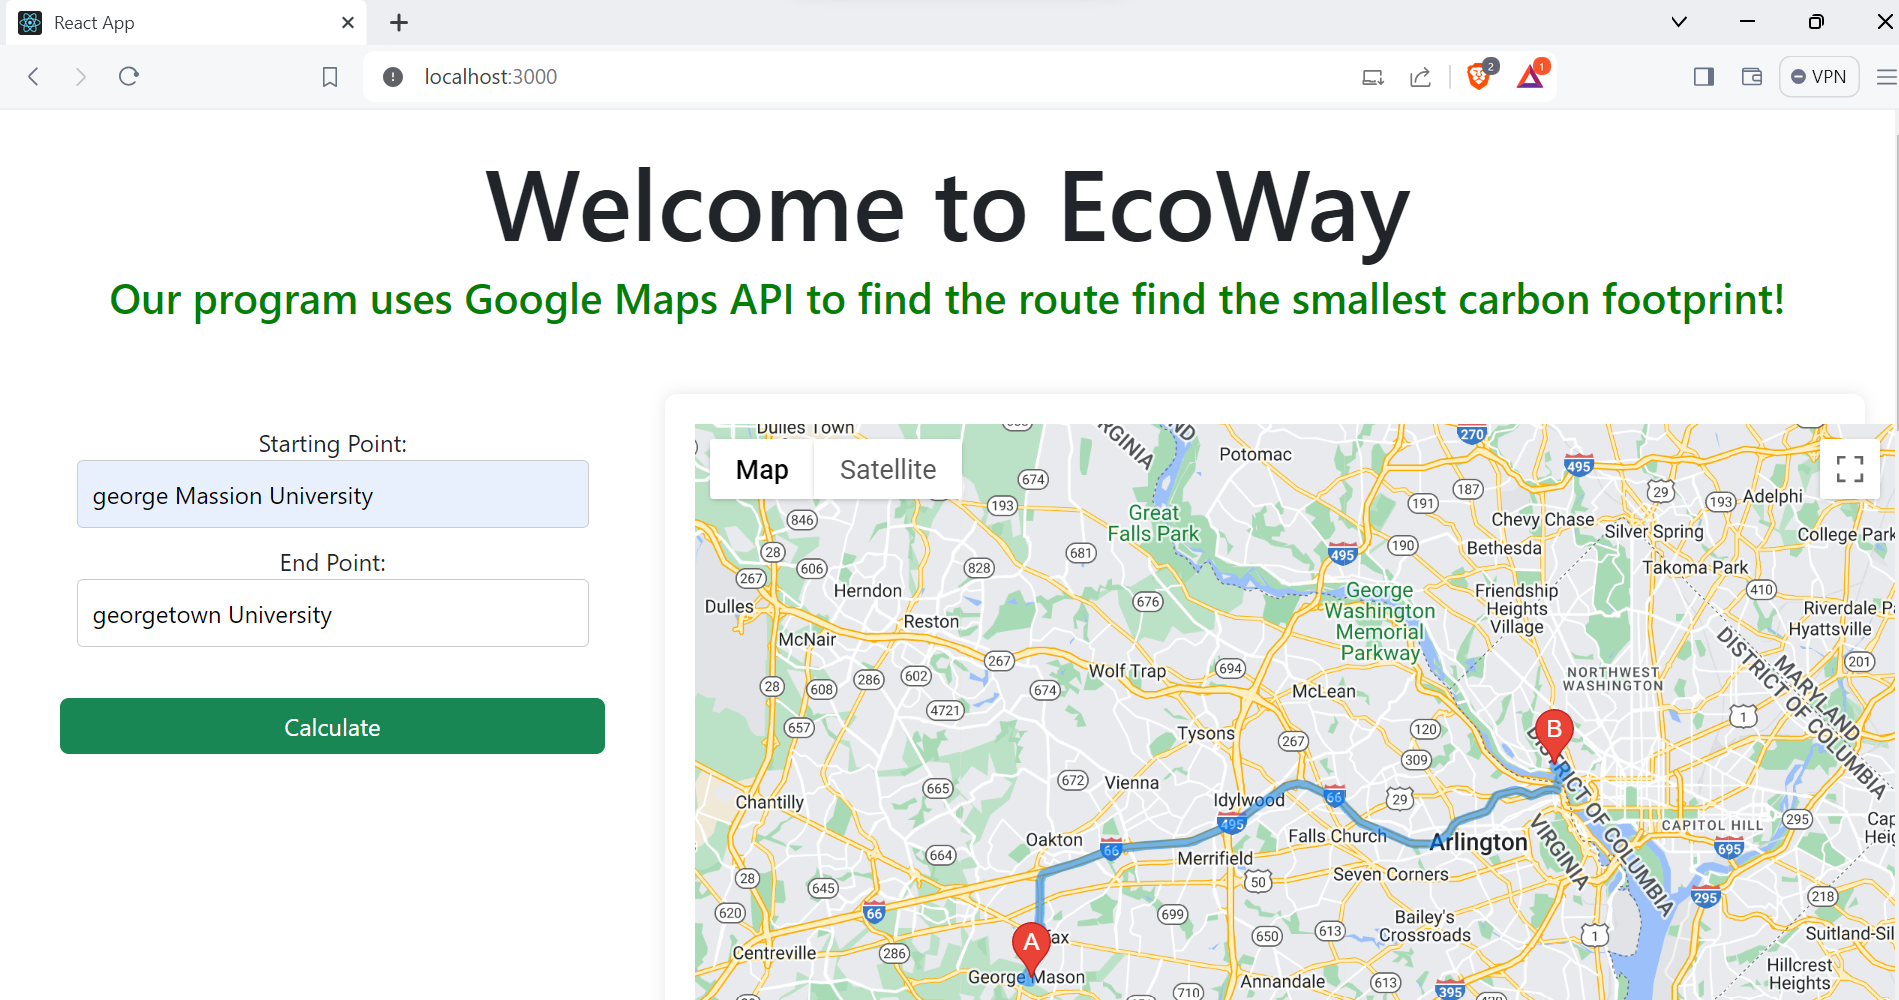
Homepage
-
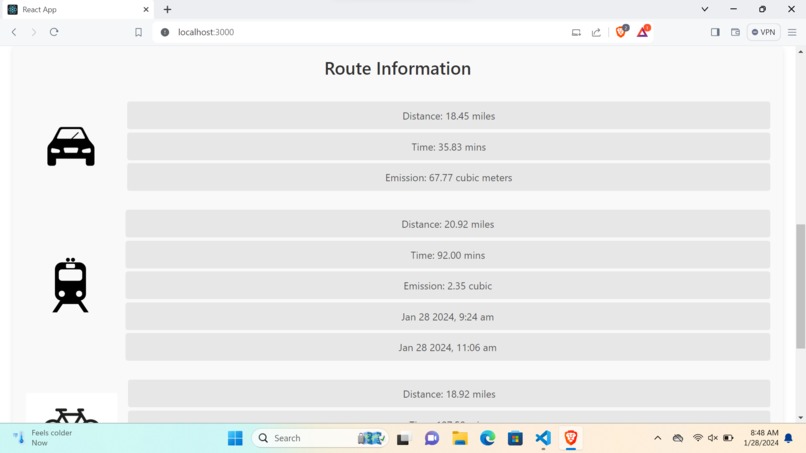
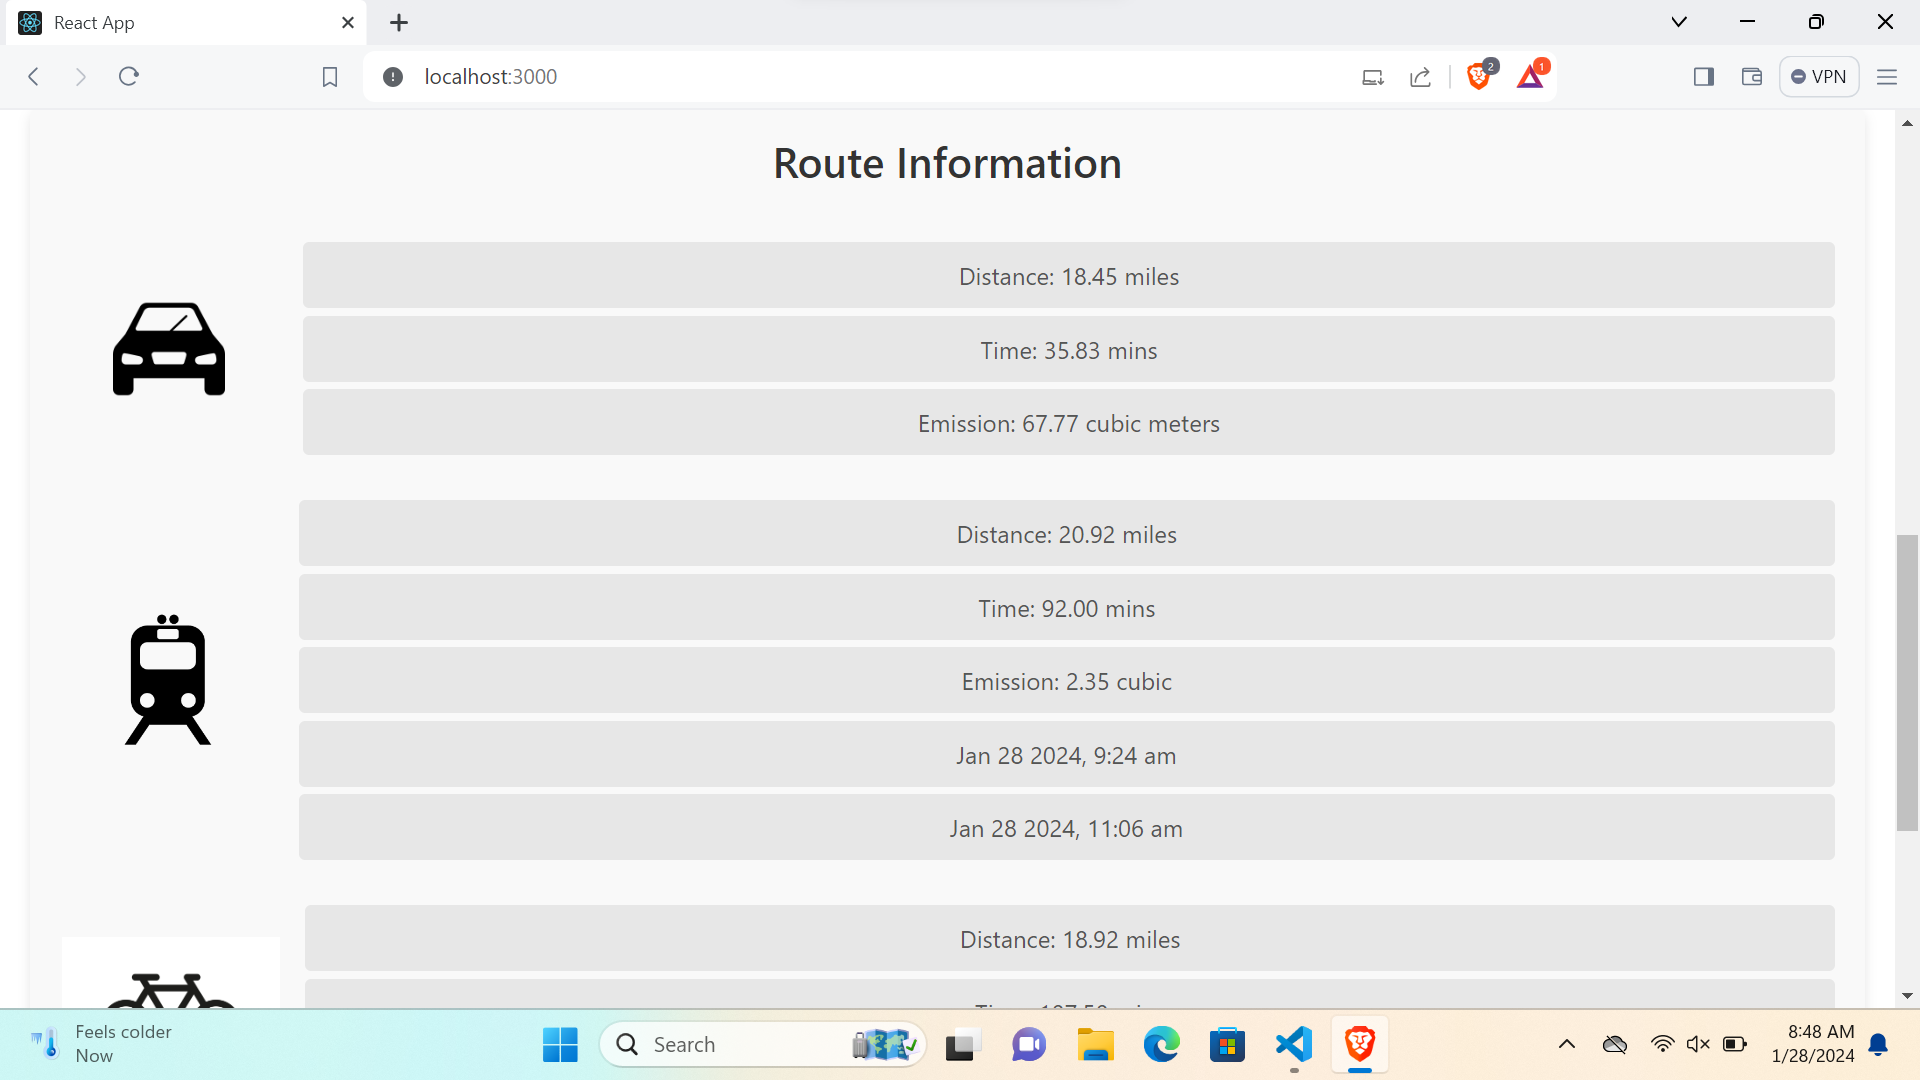
Route Data(Driving and Transit)
-
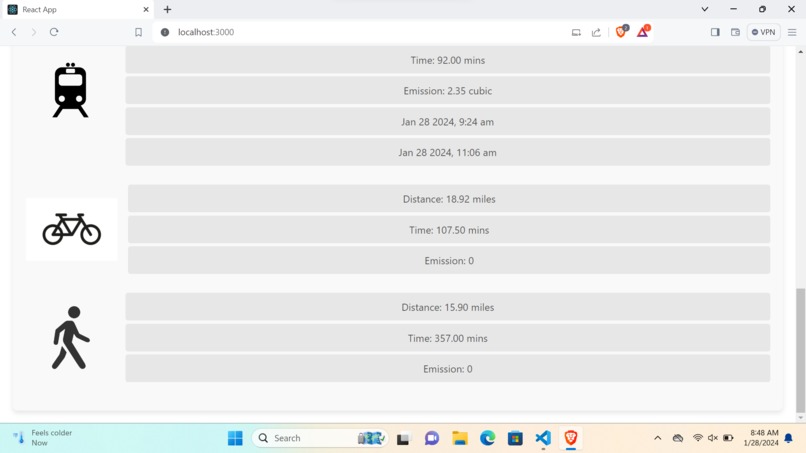
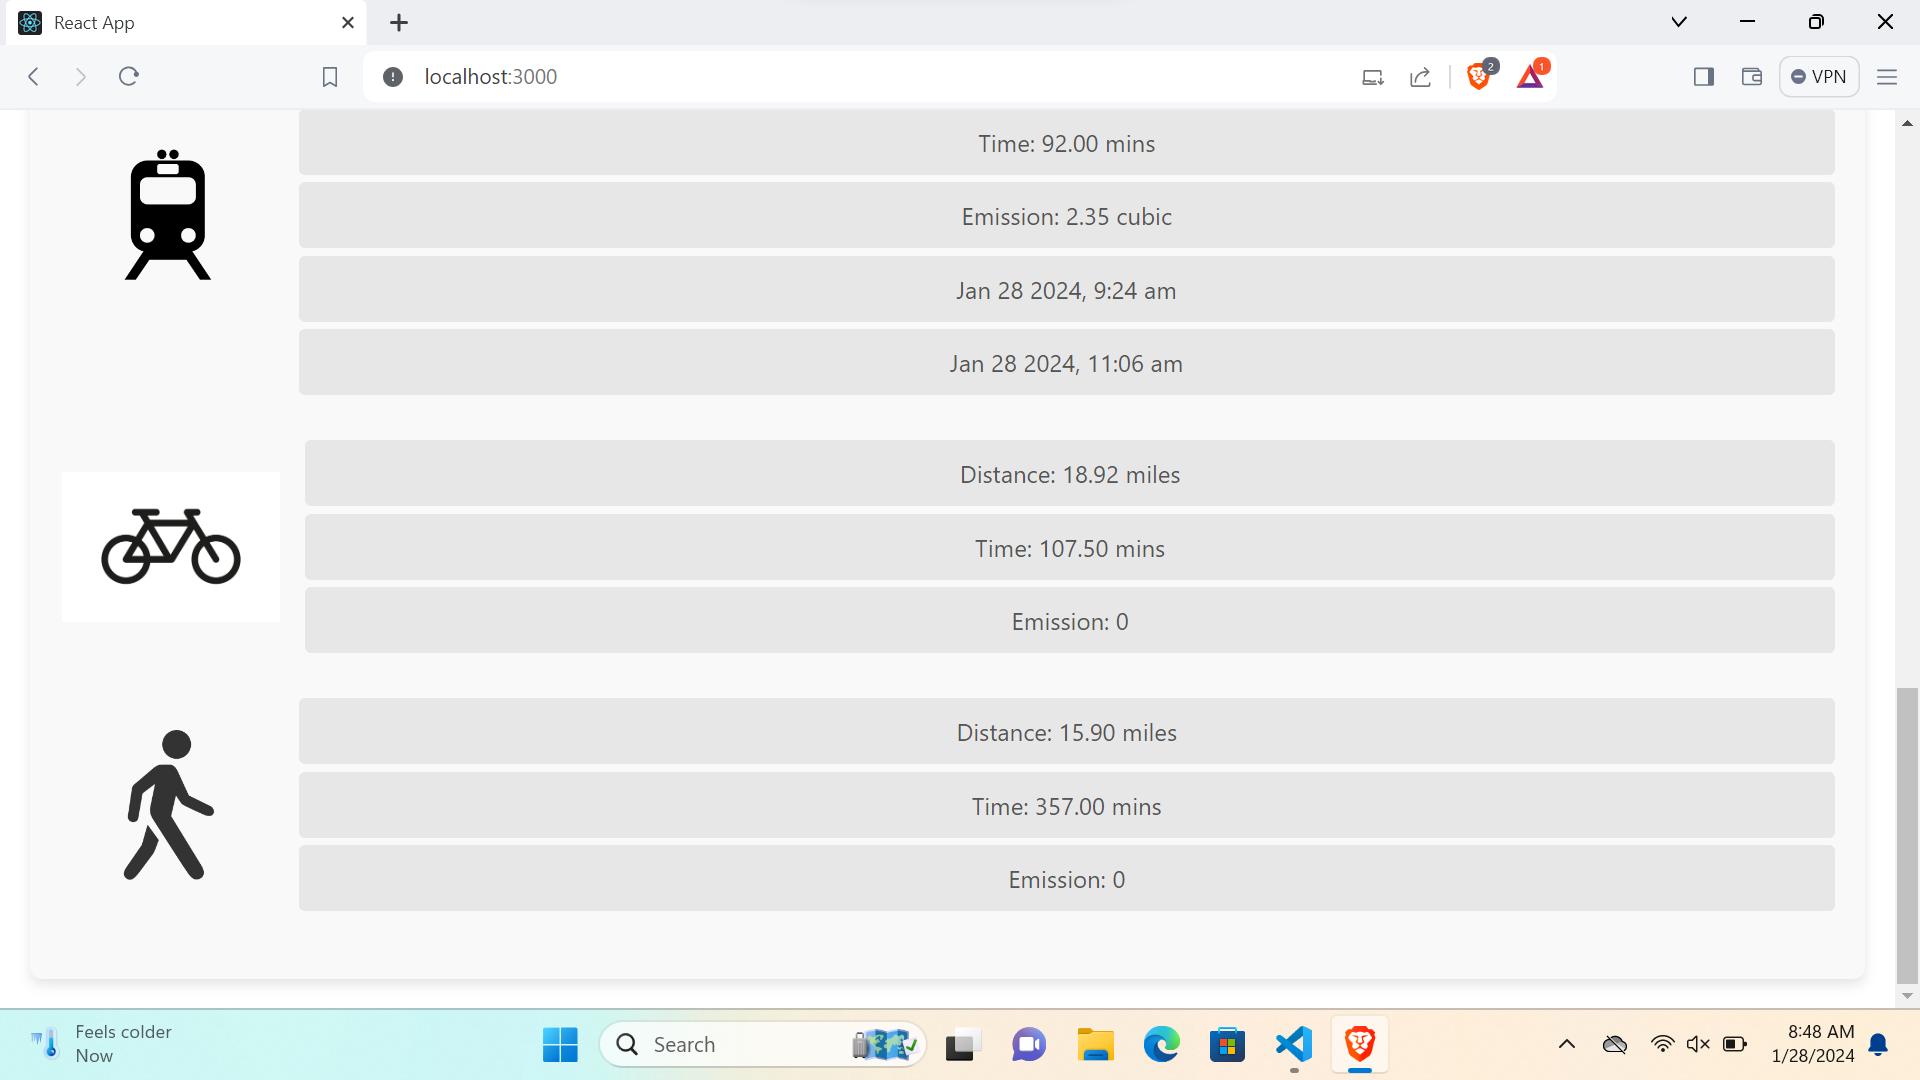
Route Data (Transit, Biking, Walking)
We noticed an issue in the of transparency in emission rates of different methods of transportation.
What it does
Our project takes in 2 address and find the following data points:
- Time
- Distance
- Emissions
For different modes of transportation( driving, transit, biking, and walking). Aswell as the time for departure and arrival of the transit
How did you do it
We used React along with Google Maps API for frontend development. For backend we used ExpressJS for handling webserver and and Here API for retrieve real-time route data for our different modes of transportation.
Challenges we ran into
We found retrieving data from different API and ensuring compatibility to be difficult. Another obstacle was making our data efficient across different data types.
Accomplishments that we're proud of
We are proud to have a successful project. We worked hard over this weekend and are proud to see our hard work.
What we learned
We learned how to work in a team and divide tasks based on our teammate's skills. All of us worked with new API and learned how to adapt.
What's next for EcoWay Express
EcoWay Express could be migrated to work as an useful google chrome extension to promote awareness of the dangerous emission caused by transportation. This project could help people make the environmentally mindful choice.

Log in or sign up for Devpost to join the conversation.