-
-
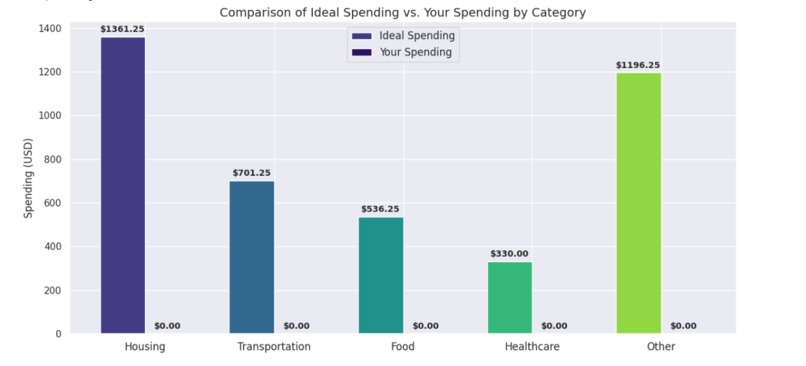
Comparision of ideal spending vs your spending
-
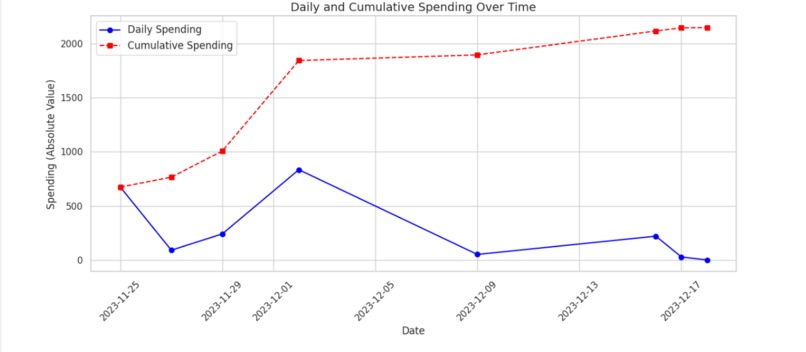
Daily and Cumulative spending over time
-

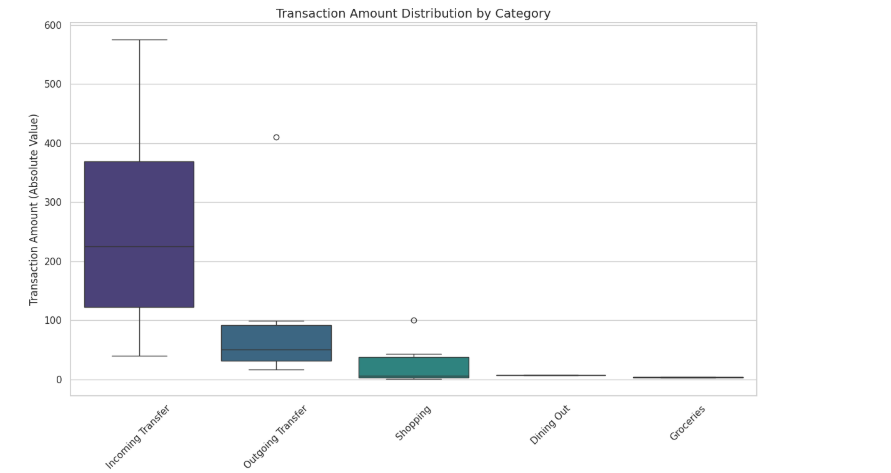
Transaction amount distribution by category


Inspiration The project was inspired by the need for individuals to gain clear, actionable insights into their spending habits. We wanted to transform the tedious task of reviewing bank statements into an engaging, even humorous, experience—one that not only highlights financial patterns but also playfully “roasts” overspending. The idea was to combine data analysis with a bit of personality, making financial reviews more relatable and fun.
What it Does Bank Statement Analysis extracts transaction data from bank statements (PDFs or JSON files) and automatically categorizes each transaction (such as Housing, Dining Out, Groceries, etc.). It then compares the user’s spending with recommended benchmarks based on age and household type, providing:
A detailed breakdown of actual versus ideal spending.
Interactive visualizations (bar charts, pie charts, radar charts, etc.) that show spending patterns.
A playful “roast” or commentary that points out where spending is significantly off track.
How We Built It Data Extraction: We used Python libraries like pdfplumber and regex to parse transaction data from various bank statement formats.
Categorization: Transactions are tagged using a rule-based system (with an extended keyword dictionary) and can be further enhanced by integrating machine learning models.
Benchmarking: Recommended spending levels were derived from surveys and research, segmented by age groups and household types.
Visualization: We leveraged Matplotlib and Seaborn to create clear, engaging visualizations (bar charts, pie charts, and radar charts) that compare actual spending against recommended benchmarks.
User Interaction: The tool prompts users for basic inputs (age, household type) and displays personalized insights based on their data.
Challenges We Ran Into Data Variability: Parsing multiple PDF formats and handling inconsistent transaction labels was a major challenge.
Data Quality: Dealing with incomplete data, OCR errors, and non-standardized entries required extensive data cleaning.
Balancing Tone: Crafting humorous roast comments without offending users was delicate—striking the right balance between fun and constructive feedback took careful iteration.
Integration Complexity: Combining data extraction, categorization, and visualization into one seamless pipeline posed integration challenges.
Accomplishments That We're Proud Of Robust Data Pipeline: We successfully built a system that can ingest and process bank statements from multiple sources with minimal manual intervention.
Accurate Categorization: Our rule-based approach, augmented with potential ML enhancements, reliably categorizes transactions even in varied formats.
Engaging Visualizations: The dynamic visual dashboards make it easy for users to see where their money is going, with clear labels and an appealing design.
User-Centric Design: Incorporating a “roast” element added personality to the tool, making financial review less mundane and more engaging.
What We Learned Data Extraction Techniques: We deepened our understanding of parsing unstructured data from PDFs and handling real-world financial data.
Machine Learning for Text: We learned valuable lessons about text categorization, including the benefits and limitations of rule-based systems versus ML models.
Visualization Best Practices: Crafting clear, aesthetically pleasing visualizations requires careful attention to layout, color schemes, and data labeling.
User Experience: Iterative testing with actual users taught us the importance of balancing humor with useful financial advice.
What's Next for Bank Statement Analysis Enhanced Categorization: Integrate machine learning models to improve transaction categorization and adapt to new, emerging spending patterns.
Real-Time Integration: Develop API connections with financial aggregators (like Plaid) to allow real-time data ingestion and analysis.
Expanded Visual Dashboards: Build more interactive dashboards that include predictive analytics, trend forecasting, and personalized recommendations.
Mobile App Development: Consider developing a companion mobile app to bring instant, on-the-go insights and financial roasts to users.
User Feedback Loop: Implement features for user feedback so the tool can learn and tailor its recommendations and roast comments even more effectively over time.
Built With
- matplotlib
- pdfplumber
- python
- seaborn

Log in or sign up for Devpost to join the conversation.