Inspiration
Our starting point was simple: how can we forecast rent growth in 2026 without being misled by portfolio averages?
While exploring Équinoxe’s data, we found a clear example. In 2023, the portfolio’s median rent suggested an increase of 10.85%. But when each apartment was compared with its own previous lease, contractual rent growth was only 2.29%.
A large part of that gap was therefore explained by changes in the composition of the real estate portfolio.
What we built
We tracked each unit individually and compared its new lease with the previous one. We also distinguished between the rent stated in the lease and the rent actually captured after promotions and concessions.
For example, in 2025:
- median contractual rent growth: 7.05%
- median effective rent growth: 3.58%
That difference led us to base our forecast on effective rent rather than simply the rent written in the lease.
Our forecasting logic is:
$$ \text{Forecast}{t} = \text{Asking Rent Growth}{t-1} - \text{Impact of Concessions}_{t-1} $$
In other words, we look at how asking rents are evolving and subtract the portion of that growth that is historically absorbed by concessions.
For 2026:
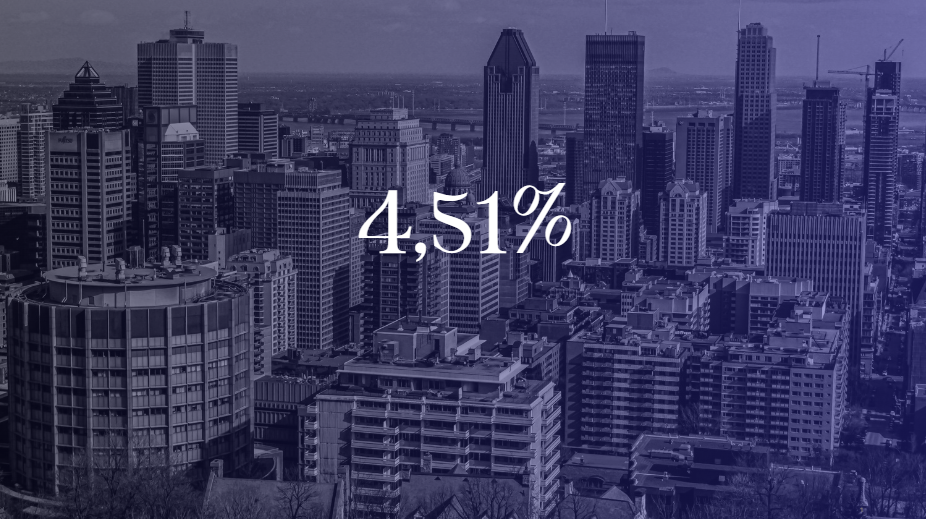
$$ \text{Forecast}_{2026} = 7.98\% - 3.47\% = 4.51\% $$
Our central estimate is therefore:
$$ \boxed{4.51\%} $$
with an empirical sensitivity range of approximately:
$$ \boxed{3.04\% \; \text{to} \; 5.99\%} $$
What we learned
Our main challenges were to:
- separate genuine rent growth from changes in the mix of units;
- distinguish lease renewals from tenant turnover;
- measure the impact of concessions;
- account for the different market and regulatory contexts in Quebec and Ontario;
- ensure that our backtests never relied on information that would not have been available at the time.
How we validated the result
We backtested the method on 2023, 2024 and 2025.
The resulting mean absolute error was approximately:
$$ \text{MAE} \approx 1.48 \text{ percentage points} $$
We also tested an alternative, reasonable way of measuring the impact of concessions. It produced a 2026 estimate of 4.63%, compared with our main estimate of 4.51%.
The difference is only:
$$ 4.63\% - 4.51\% = 0.12 \text{ percentage points} $$
This gave us additional confidence that the result was not being driven by a single modelling choice.
Finally, we compared our estimate with public market data from CMHC and Statistics Canada, while also accounting for the different regulatory environments in Quebec and Ontario.
Result
Our final estimate is:
$$ \boxed{\text{Estimated rent growth in 2026: } 4.51\%} $$
Built With
- jupyter

Log in or sign up for Devpost to join the conversation.