Inspiration
I was in a car crash around 4 months ago. I was hospitalized in the ICU for 3 weeks and underwent extensive surgery. Since then I've been somewhat engrossed in urban transportation/transportation safety planning and the incredibly important role that road planning plays in traffic accidents.
What it does
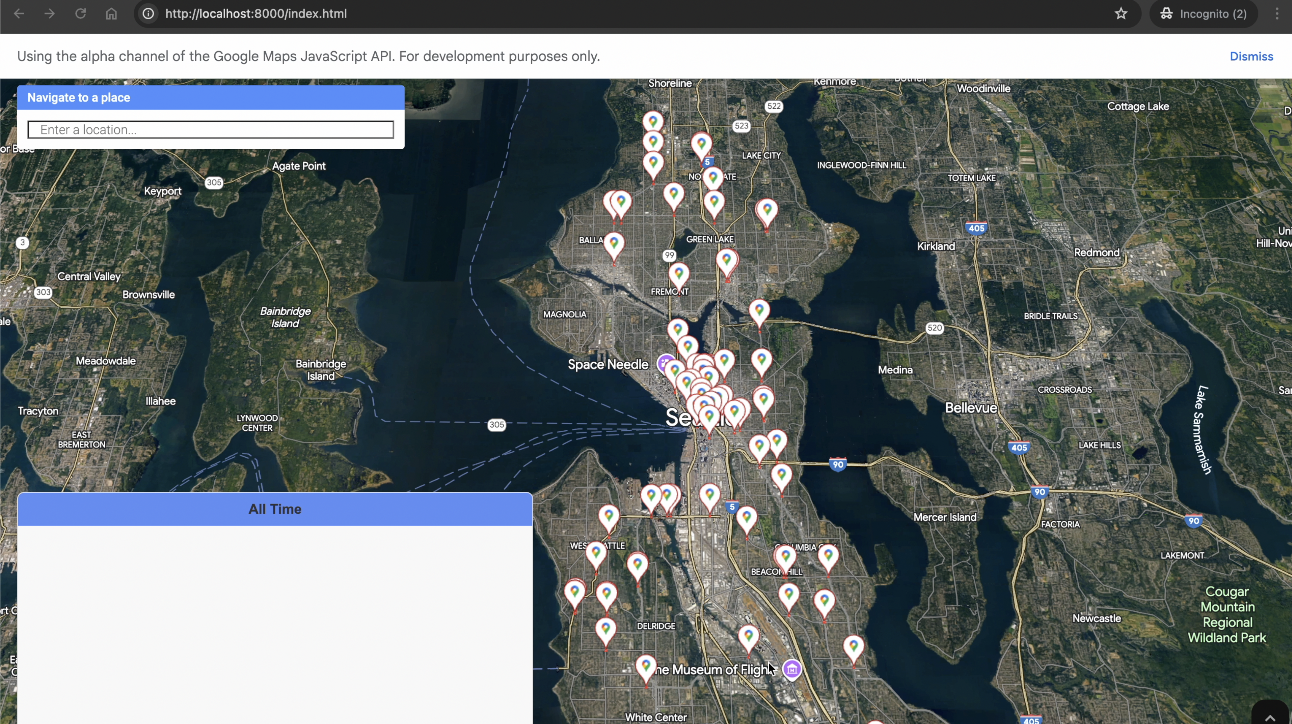
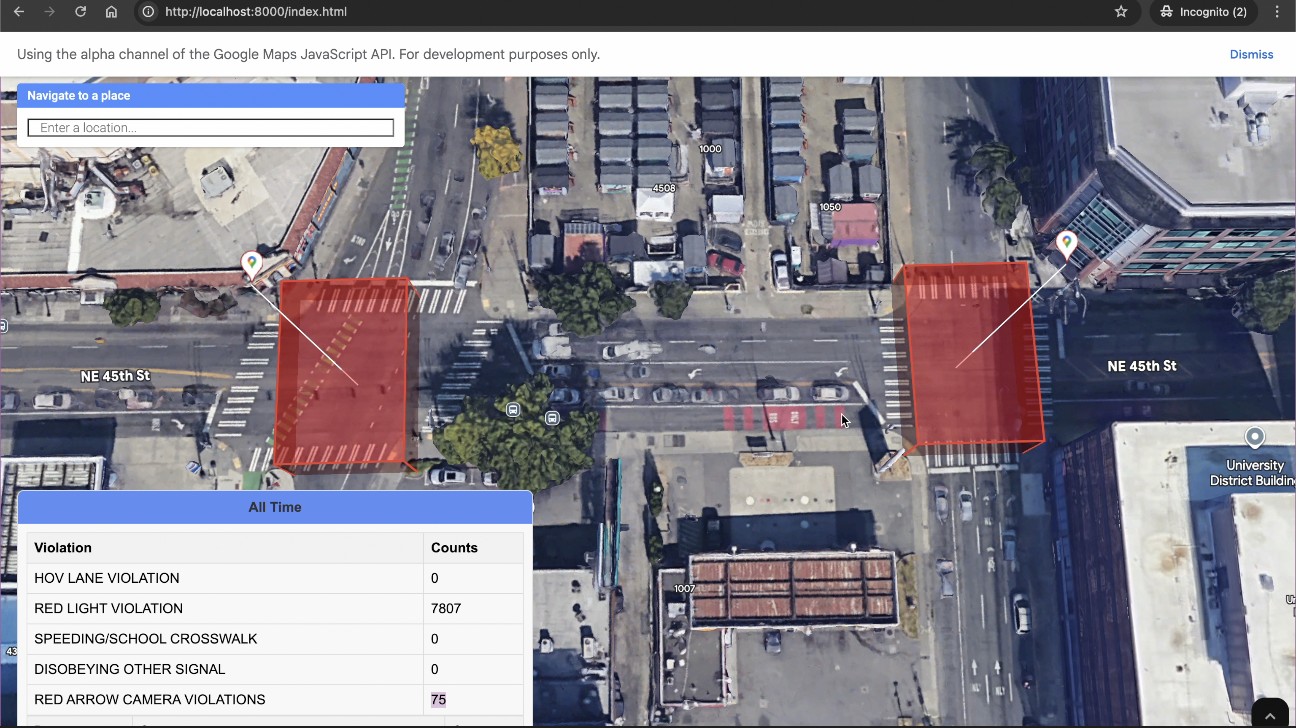
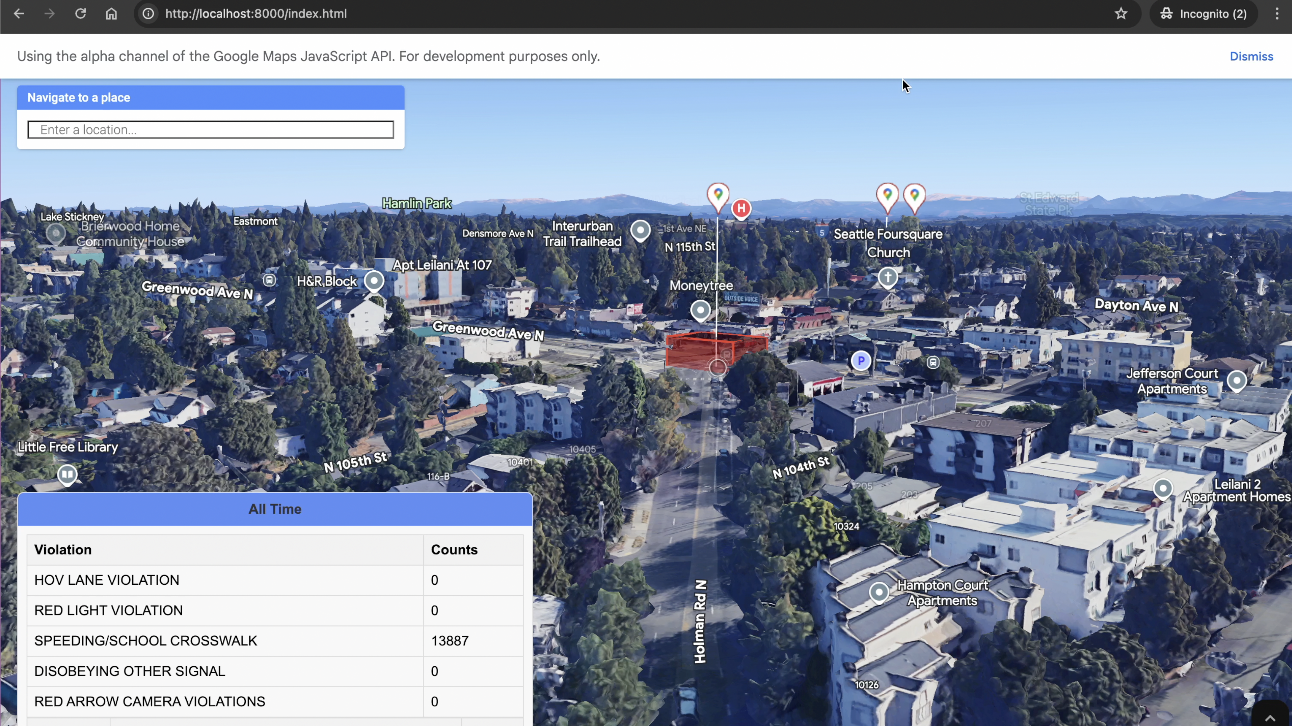
Uses Google's 3D photorealistic mapping to visualize traffic camera data with transparent polygons. Extruded interactive GMap markers makes each location both easier to locate and have the data of the location immediately accessible. An additional panel shows a total count for each kind of violation recorded as well as every individual entry recorded at this location.
How we built it
This project uses City of Seattle DOT traffic camera data available as CC0 Public Domain via freedom of information requests. As such, this project could be immediately translated to any other transportation department across the country (maybe even around the world) using data already stored.
- Used pandas to clean and compress the original CSV file from the City of Seattle to something more workable directly in javascript and html.
- Mapping of each camera address to coordinates.
- Used PapaParse with compressed CSV file to construct polygons and interactive markers on the 3D map.
- Added direct access to compressed data via scrollable panel.
Challenges we ran into
- Slight roadblock in not being able to directly attach an index value to markers so I ended up having to use the provided event.target.position.Fg code to find the intended marker by using the markers coordinates and finding the index at those coordinates.
- Issues appending glyph SVG file to markers pin on 3D map (problem was mostly from local hosting) mostly fixed in the end.
What we learned
- Familiarity with new Google maps 3D API.
- Use cases of 3D photorealistic mapping.
- PapaParse in JS data management.
What's next for 3D Visualization of Seattle Traffic Camera Data
- Frontend Improvements in UI and UX
- Graphical Representations of Data


Log in or sign up for Devpost to join the conversation.