-
-
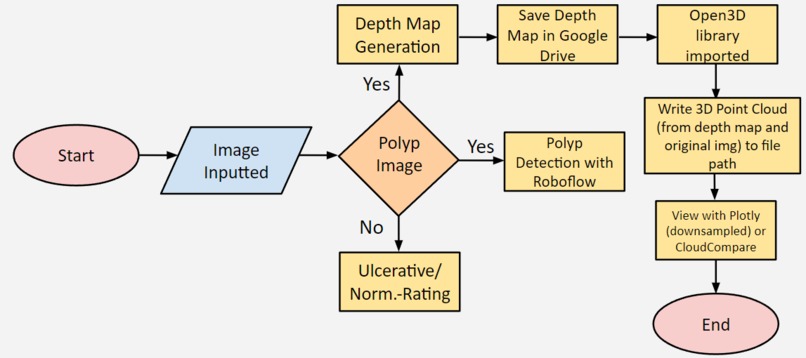
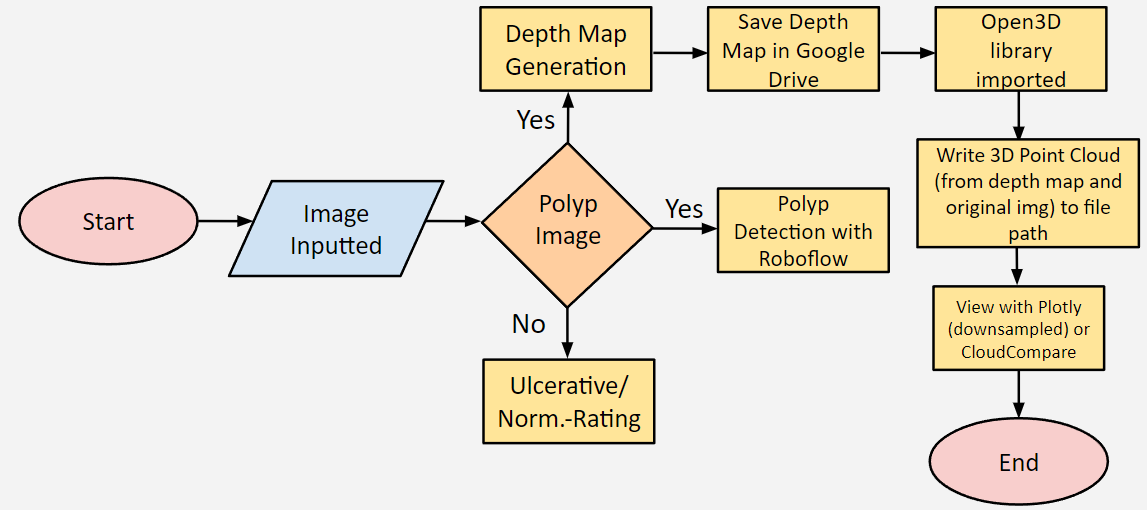
Flowchart of Pipeline
-
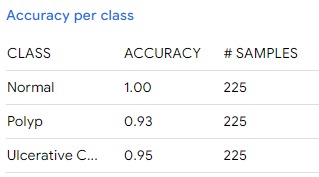
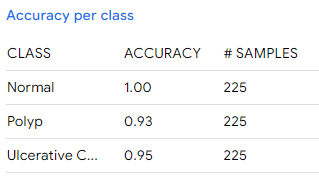
Convolutional Neural Network (CNN) Metrics
-
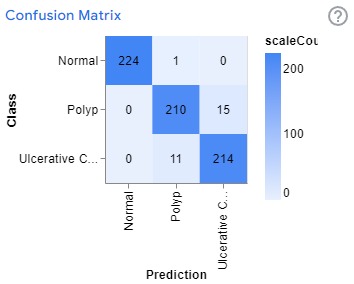
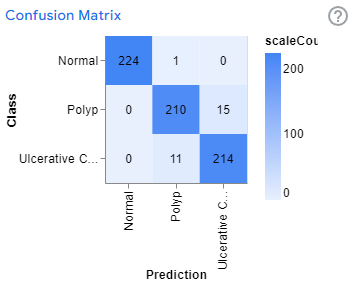
Confusion Matrix of CNN
-
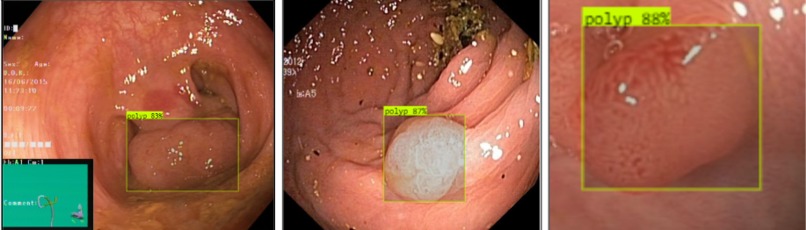
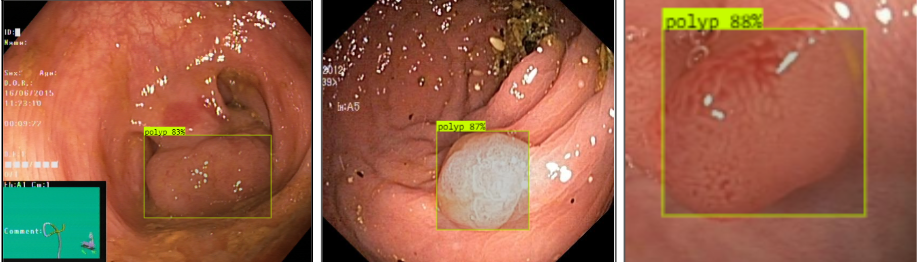
Polyp Detection
-
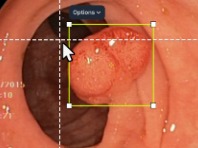
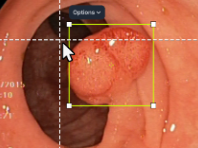
Drawing of Boundary Boxes around the Polyp in Roboflow
-
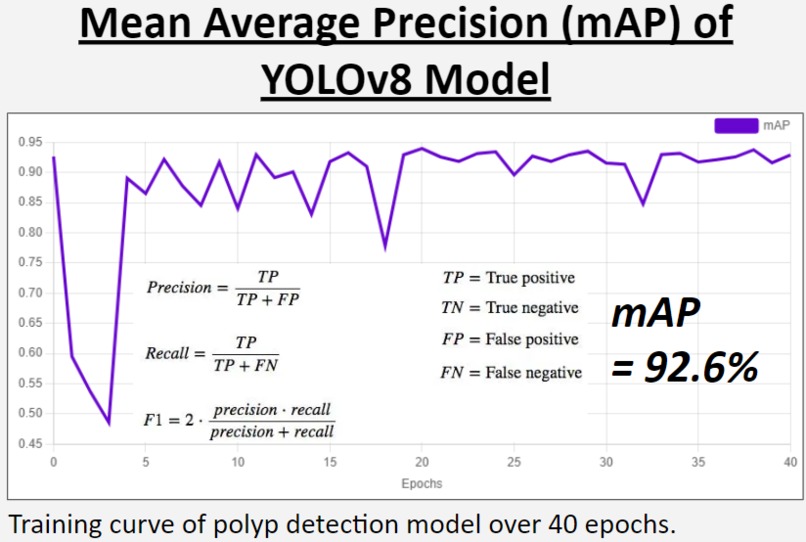
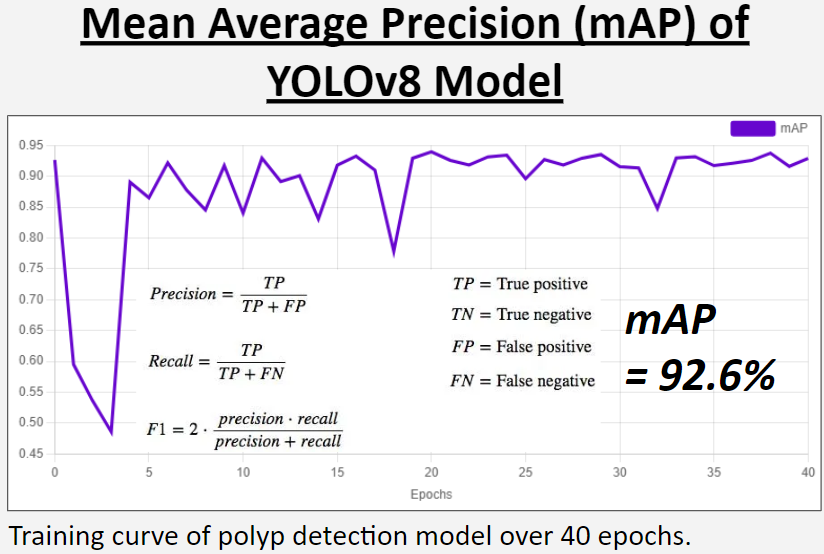
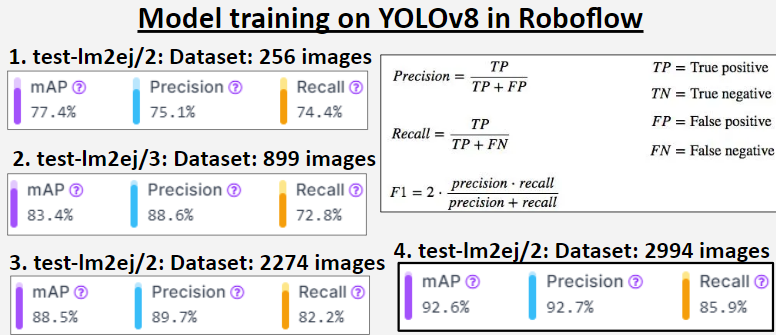
mAP (Mean Average Precision) of YOLOv8 model trained in Roboflow
-
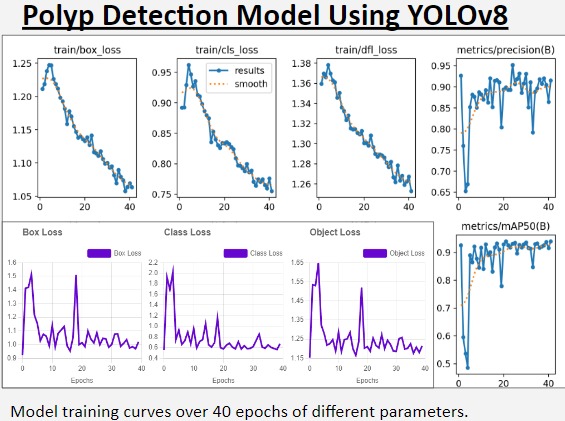
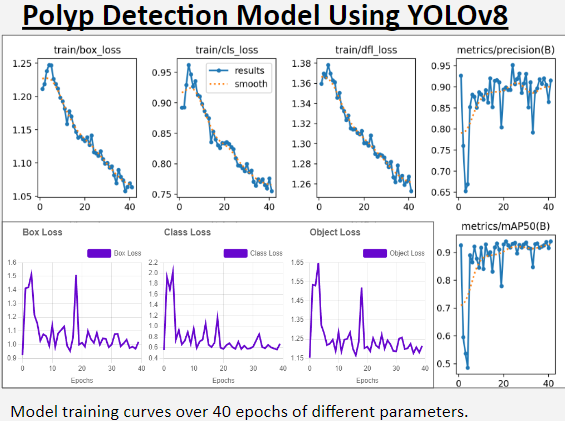
Training Graphs in Roboflow
-
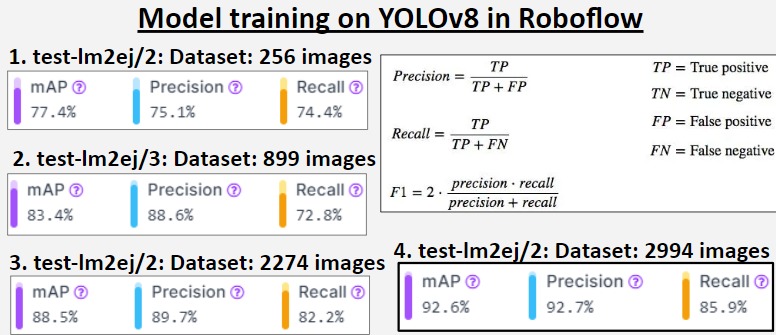
Precision metrics for all prototype models of polyp detection model trained on YOLOv8.
-
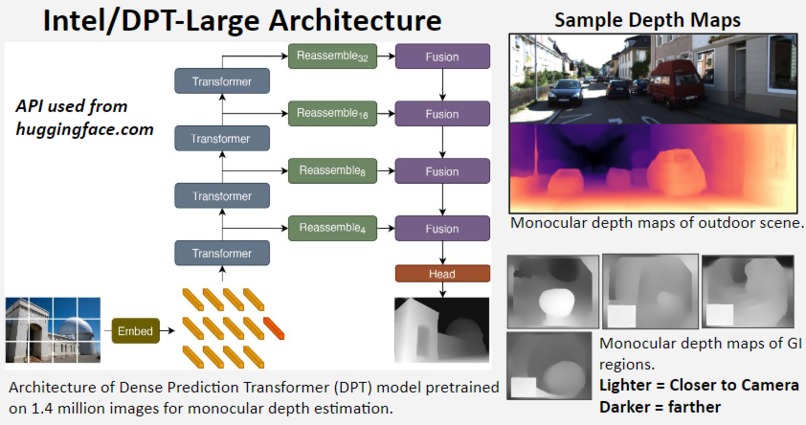
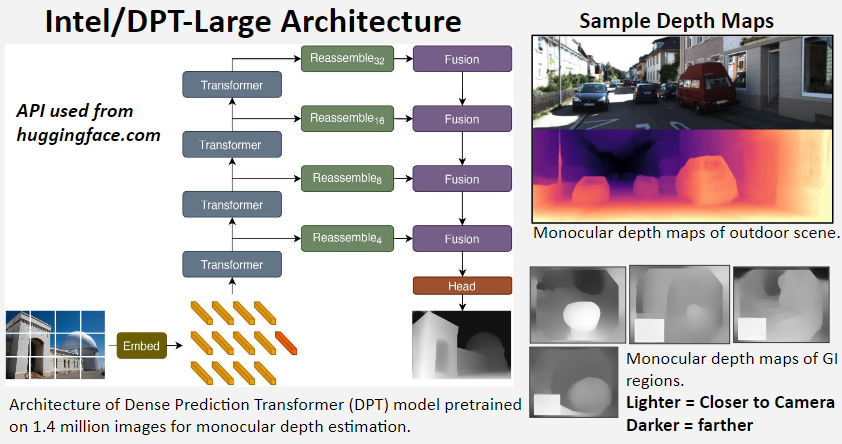
Depth Maps
-
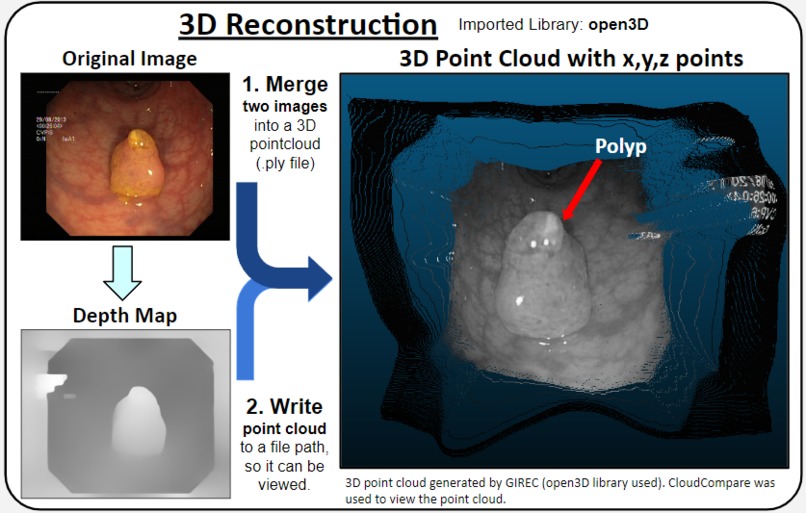
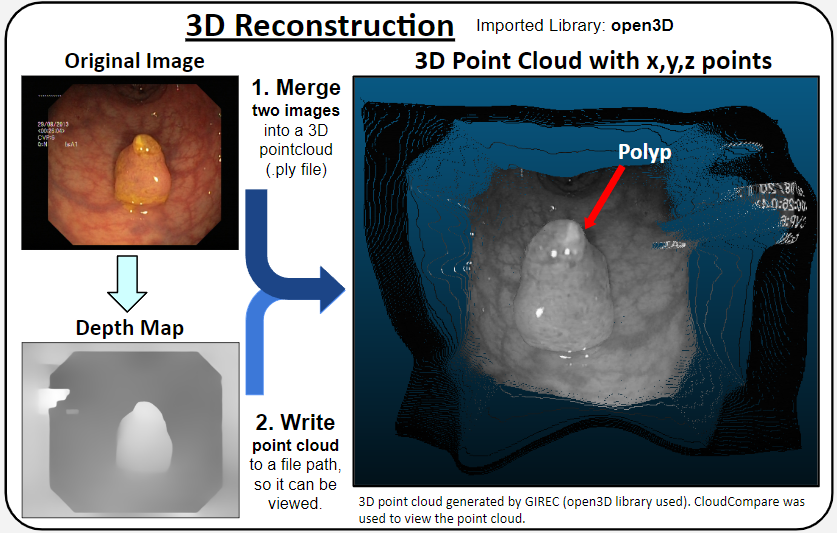
Usage of open3D library and plotly to generate 3d Point Cloud
-
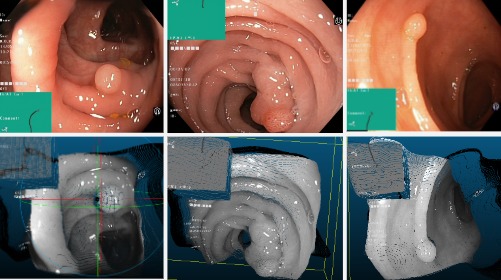
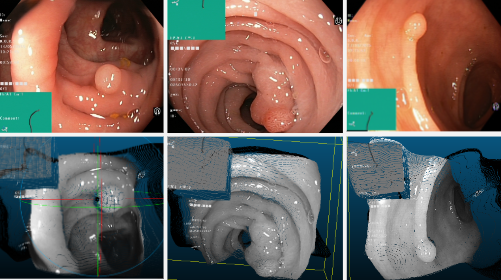
Corresponding Point Clouds
-
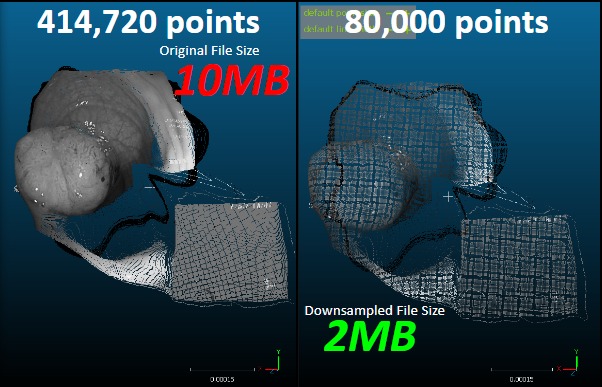
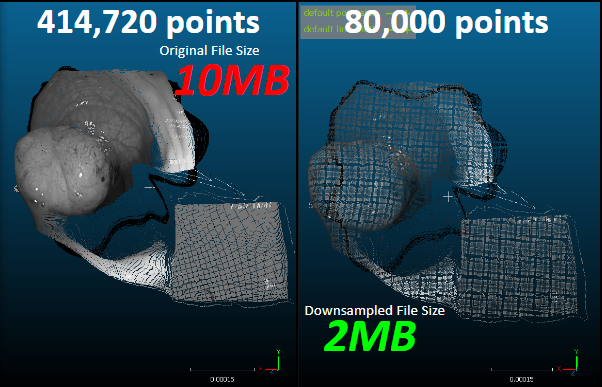
Downsampling (Point Clouds viewed using CloudCompare)
-
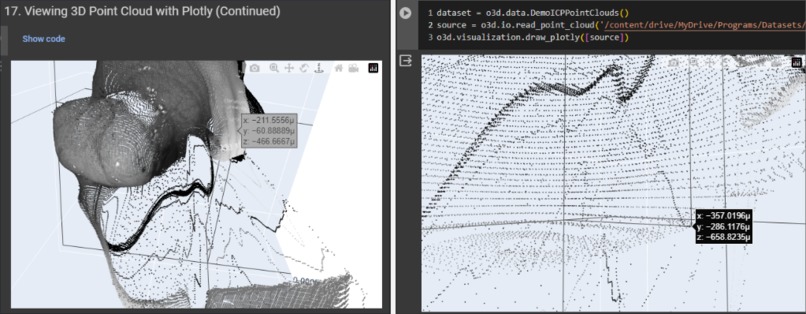
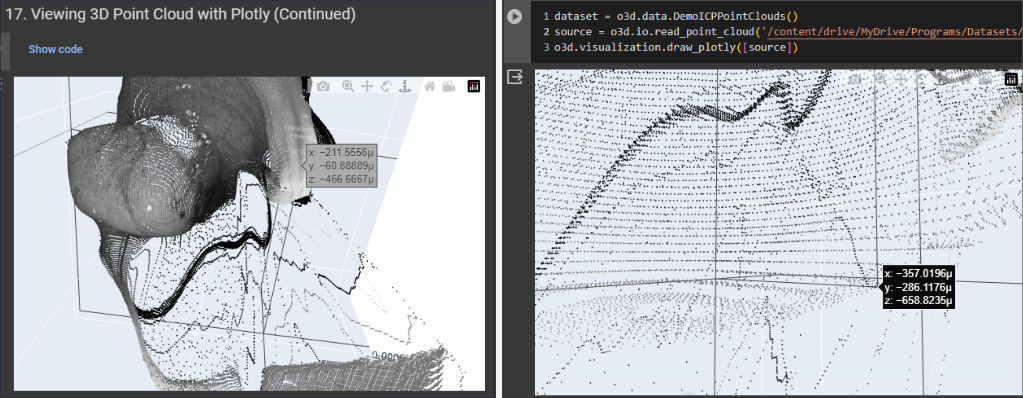
Point Clouds viewed within Google Colab Code Editor
Inspiration
Colorectal Cancer (CRC) is the third most frequently diagnosed cancer globally. Colon polyps are the main biomarker for CRC. They are projecting growths of tissue from a surface in the body. Most are harmless, but over time, some can develop into colon cancer. Current screening methods for CRC include colonoscopy, CT Colonography, magnetic resonance imaging (MRI), and ultrasound. However, these come with limitations such as they are expensive (~$1400 on average per test), an estimated 17%-28% miss rate of polyps during colonoscopy, and they may be invasive or involve harmful radiation.
Wireless Capsule Endoscopy (WCE) is a form of screening that does not involve the use of radiation. WCE involves a pill-sized camera that passes through the GI tract, taking ~50,000 images which are automatically transmitted to a signal receiver on a belt. Limitations are that images suffer from lower resolution making it difficult for radiologists to find polyps.
The rationale behind this research is to address the critical need for early and accurate polyp detection. The problem to solve is the lack of accessible and cost-effective tools for polyp detection and 3D reconstruction through depth mapping of dataset images. I have also experienced the side effects of radiation from the x-rays as a result of me breaking by left arm twice which has led me to research how radiation can be mitigated. Additionally, I feel that AI can have a significant impact on humanity as it can aid professionals in their medical tasks which may involve radiation.
Monocular Depth Estimation is the task of estimating the depth value (distance relative to the camera) of each pixel given a single (monocular) RGB image. Monocular depth estimation has applications in 3D scene reconstruction, autonomous driving, and Augmented Reality (AR). The input needs to be an RGB image scene that contains a change in depth throughout the image. The regions of the image that are predicted to be farther are darker in the depth map while the regions the depth prediction model thinks are closer to the camera are lighter in color.
What it does
A pipeline that can differentiate polyps between normal, polyp, and ulcerative colitis with a calculated estimate of 93% accuracy, detect polyps with 92.7% mAP (mean average precision) using low-resolution WCE images and use monocular depth estimation to create 3D point clouds--with ~417,000 x,y,z points---of gastrointestinal (GI) regions from a single input image.
A Convolutional Neural Network built with Google Teachable Machine first classifies an input image for if it contains a polyp, it is of ulcerative colitis, or normal. If a polyp is detected, the image will transfer onto the YOLOv8 object detection model. The model draws a boundary box around the polyp. The image is then converted to a depth map. The user should then download the depth map and save it to a file Google Drive folder. Then, after linking the file path in within the code of the Google Colab file, the pipeline uses the depth map and original image to generate a 3D point cloud which can be saved onto a computer or viewed within Colab.
How I built it
DATA CURATION and POLYP DETECTION: Use a dataset containing 2400 images with 800 images each of ulcerative colitis, normal, and polyp images from a publicly available dataset from Kaggle.com. Integrate a monocular depth estimation model (Intel DPT [Depth Prediction Transformer]-Large). The polyp detection model was trained in Roboflow.com, which utilized the object detection model YOLOv8 to draw boundary boxes around polyps. Manually, and in conjunction with AI (Prototypes 1-3, as they were made), 1300 images were annotated into the class label: “polyp”
3D RECONSTRUCTION: The model writes the 3D model file onto a specified folder path and shows the 3D model within the code editor environment through the API hugging-face Intel-DPT Large and through importing the open3D library.
DATA ANALYSIS: There was a confidence score from both the convolutional neural network trained with Teachable Machine by Google (more than 95% on most images) and Roboflow.
Teachable Machine, Roboflow, and Intel-DPT Large were imported into the pipeline in Google Colab through the use of APIs (Application Programming Interfaces).
Challenges I ran into
An obstacle was that Google Colab kept restarting the runtime when attempting to display a point cloud of 417,000 points. It was found that the maximum points that could be shown plotly in Google Colab was about 80,000 points. Downsampling was done to view the 3D point cloud without the use of external software.
Accomplishments that I'm proud of
- A model pipeline was developed that creates a 3D reconstruction from a single image of the inside of the GI tract.
- A value for voxel size was determined that maximizes 3D points in a point cloud for use in a single model.
- The decrease of data points in a 3D point cloud can significantly aid radiologists in clinics as this code algorithm can work within the model without any other software.
- Detected and drew boundary boxes around polyps from WCE images.
Limitations include no color and downsampling which may be done. This model may aid in the finding of polyps by reconstructing the colon. The decrease of data points in a 3D point cloud may aid radiologists in clinics as this algorithm can work within the model without any other software.
What I learned
Experimentation was done using the Google Colab code notebook which used the cloud-based hardware accelerator NVIDIA Tesla T4 GPU, with 2560 CUDA cores and 16GB VRAM. 51Gb of RAM was also used through the cloud-based Colab server, however, the change in the amount of RAM did not have a noticeable effect when displaying the 3D point cloud. On the other hand, the development machine did seem to have an effect on whether the 3D point cloud was able to be displayed. Compared to a computer with Intel HD graphics without a dedicated GPU, a computer with an NVIDIA GTX 1650 Super graphics card allowed the point clouds to be displayed without the plotly interface crashing in Colab.
What's next for 3D Reconstruction of Polyp with Monocular Depth Estimation
The model may be tweaked to be applicable to videos through 3D point clouds of consecutive frames. Limitations are no color and downsampled. If a mesh is applied to the 3D point cloud, a 3D model may be able to be printed. Investigate how many points are identical between full-size and downsampled point clouds.
References
Ahmad, Bilal, et al. “3D Reconstruction of Gastrointestinal Regions Using Single-View Methods | IEEE Journals & Magazine | IEEE Xplore.” Ieeexplore.ieee.org, 16 June 2023, ieeexplore.ieee.org/document/10154004. Accessed 29 Feb. 2024.
Li, Jingwen, et al. “Monocular Depth Estimation for 3D Map Construction at Underground Parking Structures.” Electronics, vol. 12, no. 11, 1 Jan. 2023, p. 2390, www.mdpi.com/2079-9292/12/11/2390, https://doi.org/10.3390/electronics12112390. Accessed 29 Feb. 2024.
Ma, Rong-Na, et al. “RNNSLAM: Reconstructing the 3D Colon to Visualize Missing Regions during a Colonoscopy.” Medical Image Analysis, vol. 72, 1 Aug. 2021, pp. 102100–102100, https://doi.org/10.1016/j.media.2021.102100. Accessed 27 Jan. 2024.
“WCE Curated Colon Disease Dataset Deep Learning.” Www.kaggle.com, www.kaggle.com/datasets/francismon/curated-colon-dataset-for-deep-learning. Accessed 29 Feb. 2024.
yodayoda. “From Depth Map to Point Cloud.” Map for Robots, 11 Dec. 2020, medium.com/yodayoda/from-depth-map-to-point-cloud-7473721d3f.


Log in or sign up for Devpost to join the conversation.