Inspiration
A picture is worth a thousand words. More than 70% of all external input comes through the eye.
What it does
Visualization comes to the rescue to facilitate both the human understanding and effective use of JIRA.
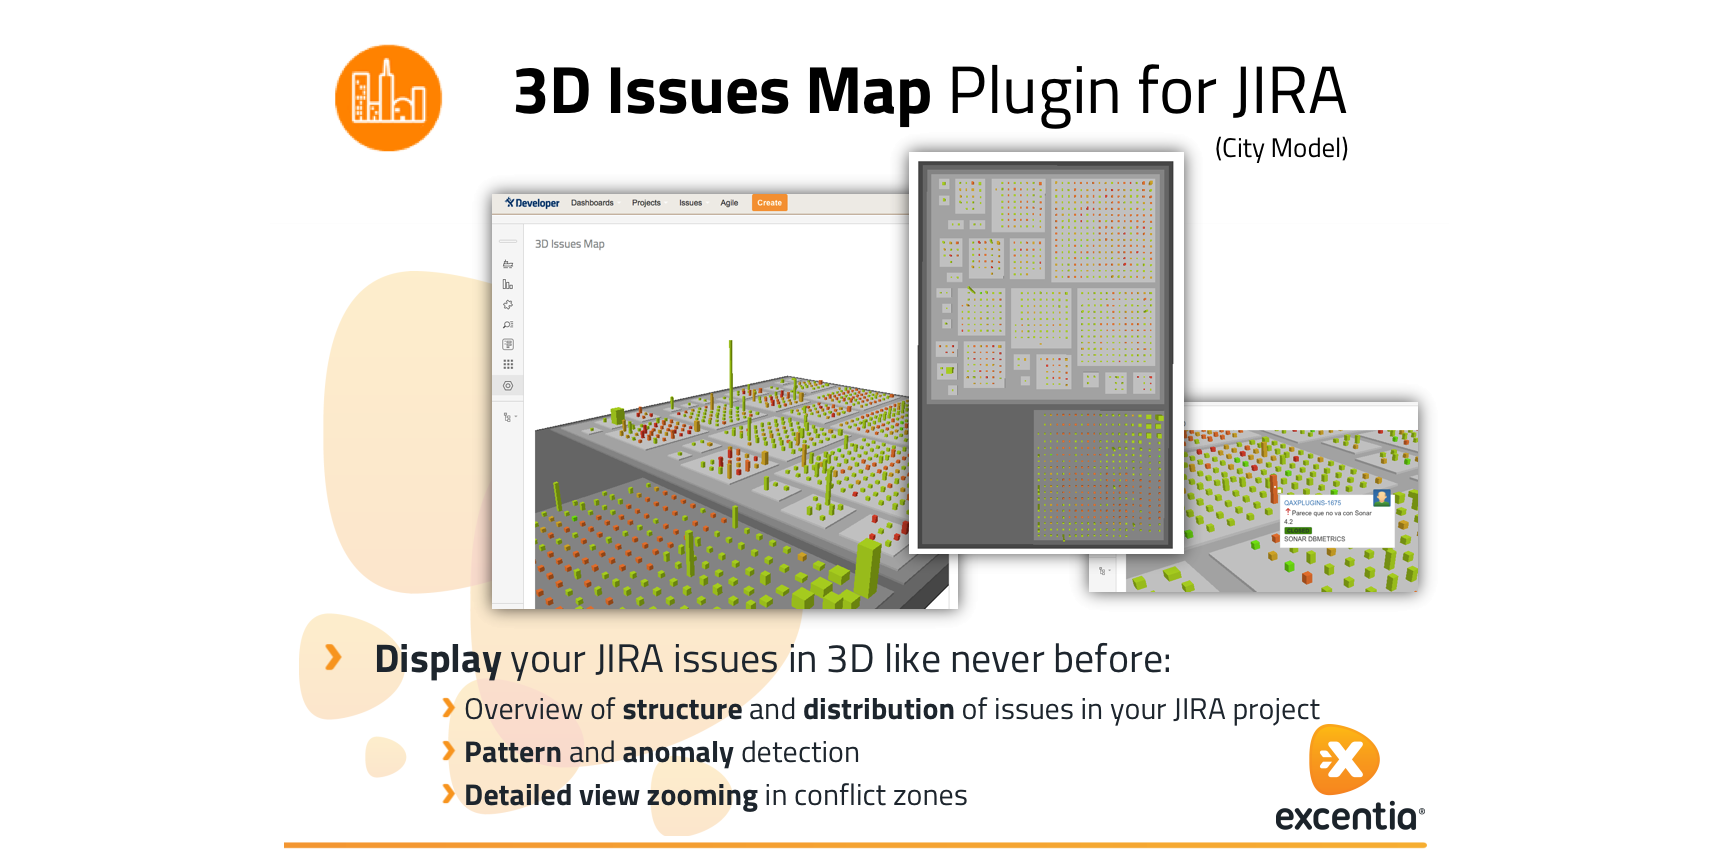
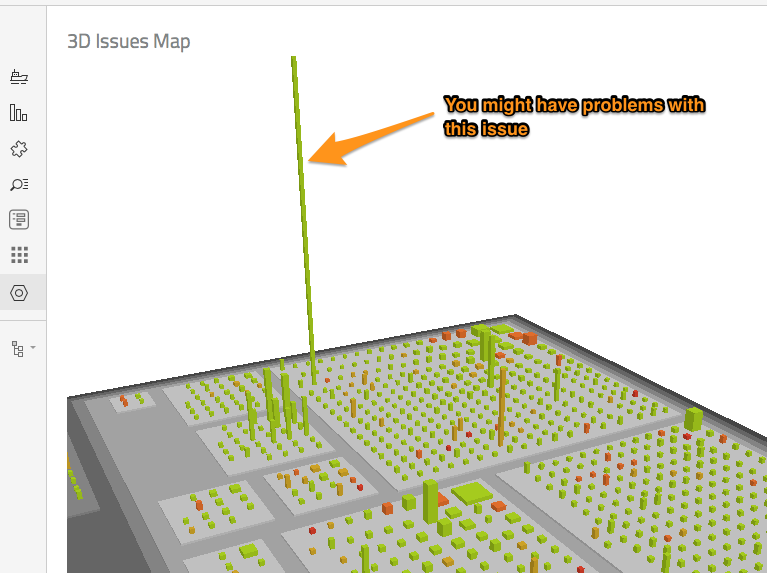
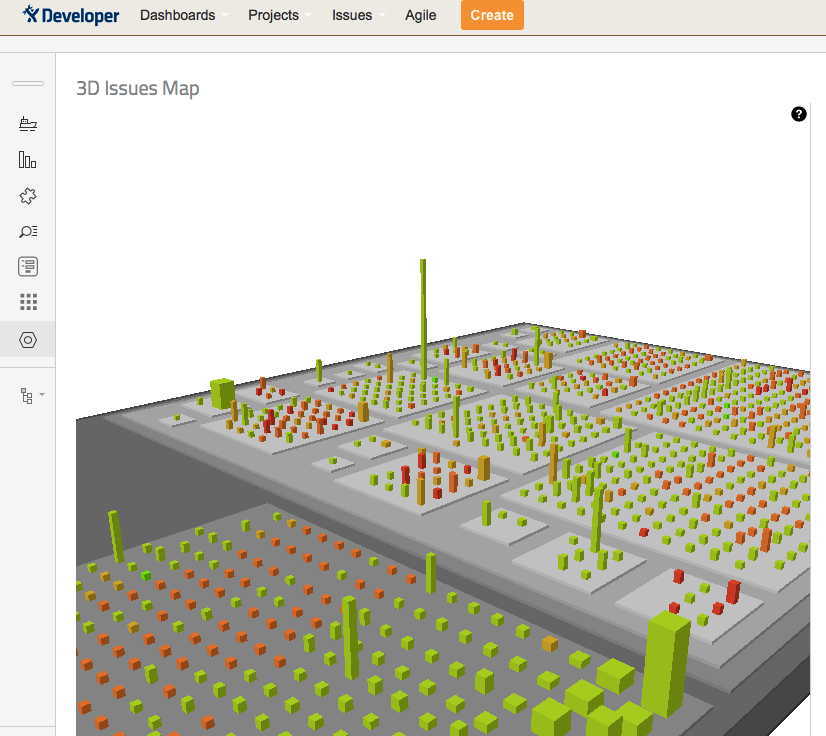
With 3D Issues Map plugin you will be able to display your JIRA Issues like a 3D City. You will be able to use image-based diagnosis for:
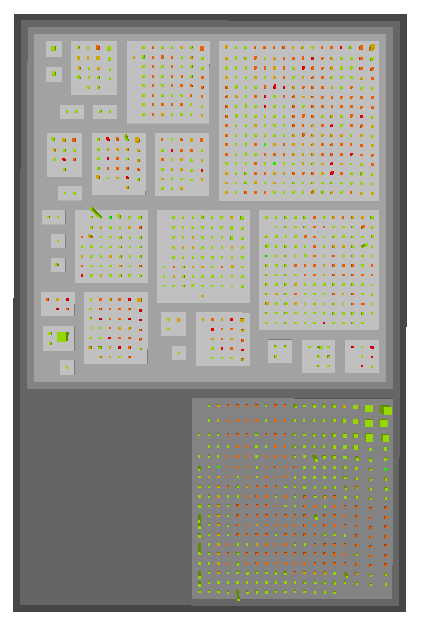
- Overview of structure and distribution of issues in your JIRA project
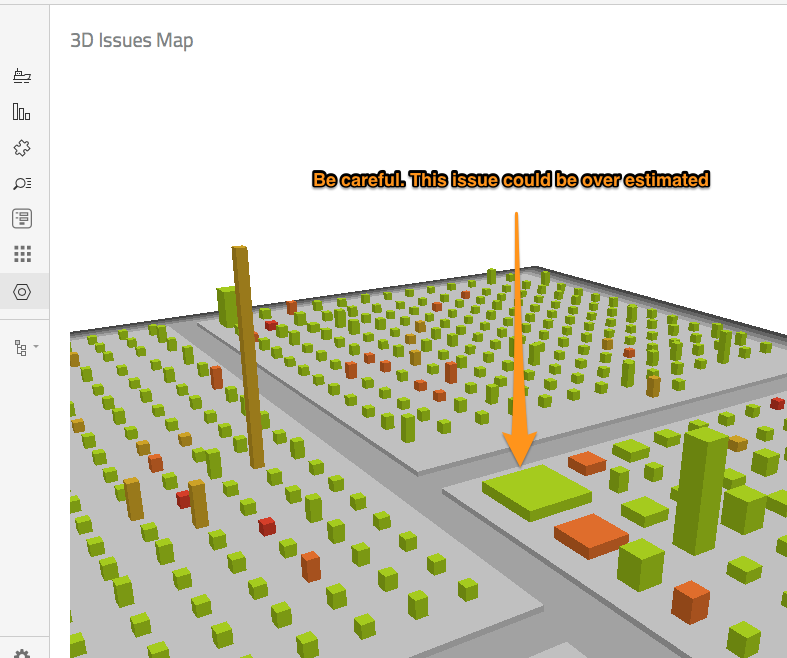
- Pattern and anomaly detection
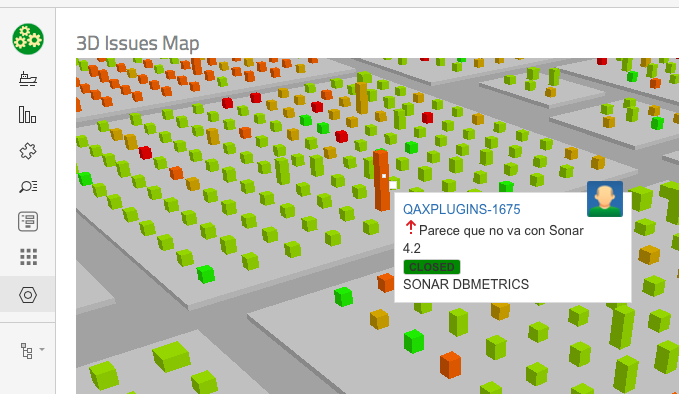
- Detailed view zooming in conflict zones
How I built it
The plugin uses:
- Java REST Service to retrieve all the issues information from backend in specific format
- A project tab panel to display the issues map
- JavaScript and WebGL to render the 3D view
- Of course, the powerful Atlassian SDK :-)
Challenges I ran into
- Selecting the most appropriate way to display the 3D map. Finally I used the city metaphor.
- Finding the best metrics to display for each issue and for each dimension (height, weight, color, ...). The first model is quite simple but it provides a lot of information.
- All the WebGL implementation to be able to rotate, translate, zooming, ... with the mouse, and also moving with the arrow keys.
Accomplishments that I'm proud of
Providing a new way to display your issues in JIRA is wonderful :-)
What I learned
With the development of the plugin I have learnt:
- How to create a 3D model with JIRA Issues information
- How to build a project tab panel and include all the resources needed.
- How to create a REST service to extract all the information and return it to the front-end in JSON format.
- How to integrate WebGL and JavaScript to render the view in a velocity template.
What's next for 3D Issues Map (City Model)
Next features will be:
- New gadgets to be able to create dashboards with the 3D issues map
- Render new 3D models to cover more metrics from JIRA, and not only issues (for instance: buildings could be users, statuses, workload, dates, ...)
- Provide a way to change in real time the 3D dimensions, so that you can choose the meaning for all of them (for instance, right now color is priority but it could be also status)


Log in or sign up for Devpost to join the conversation.