-
-
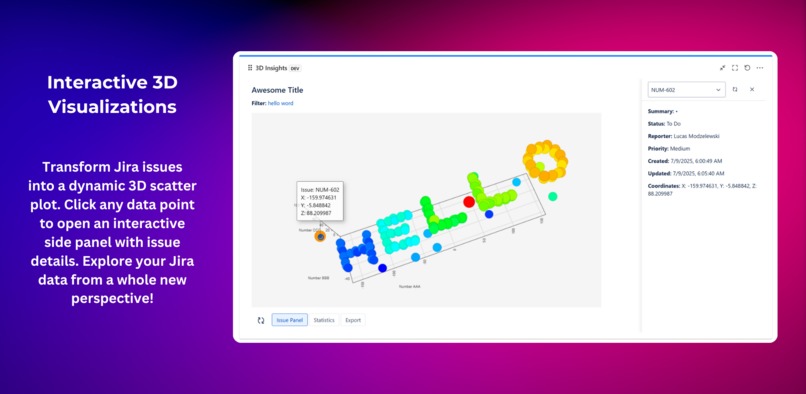
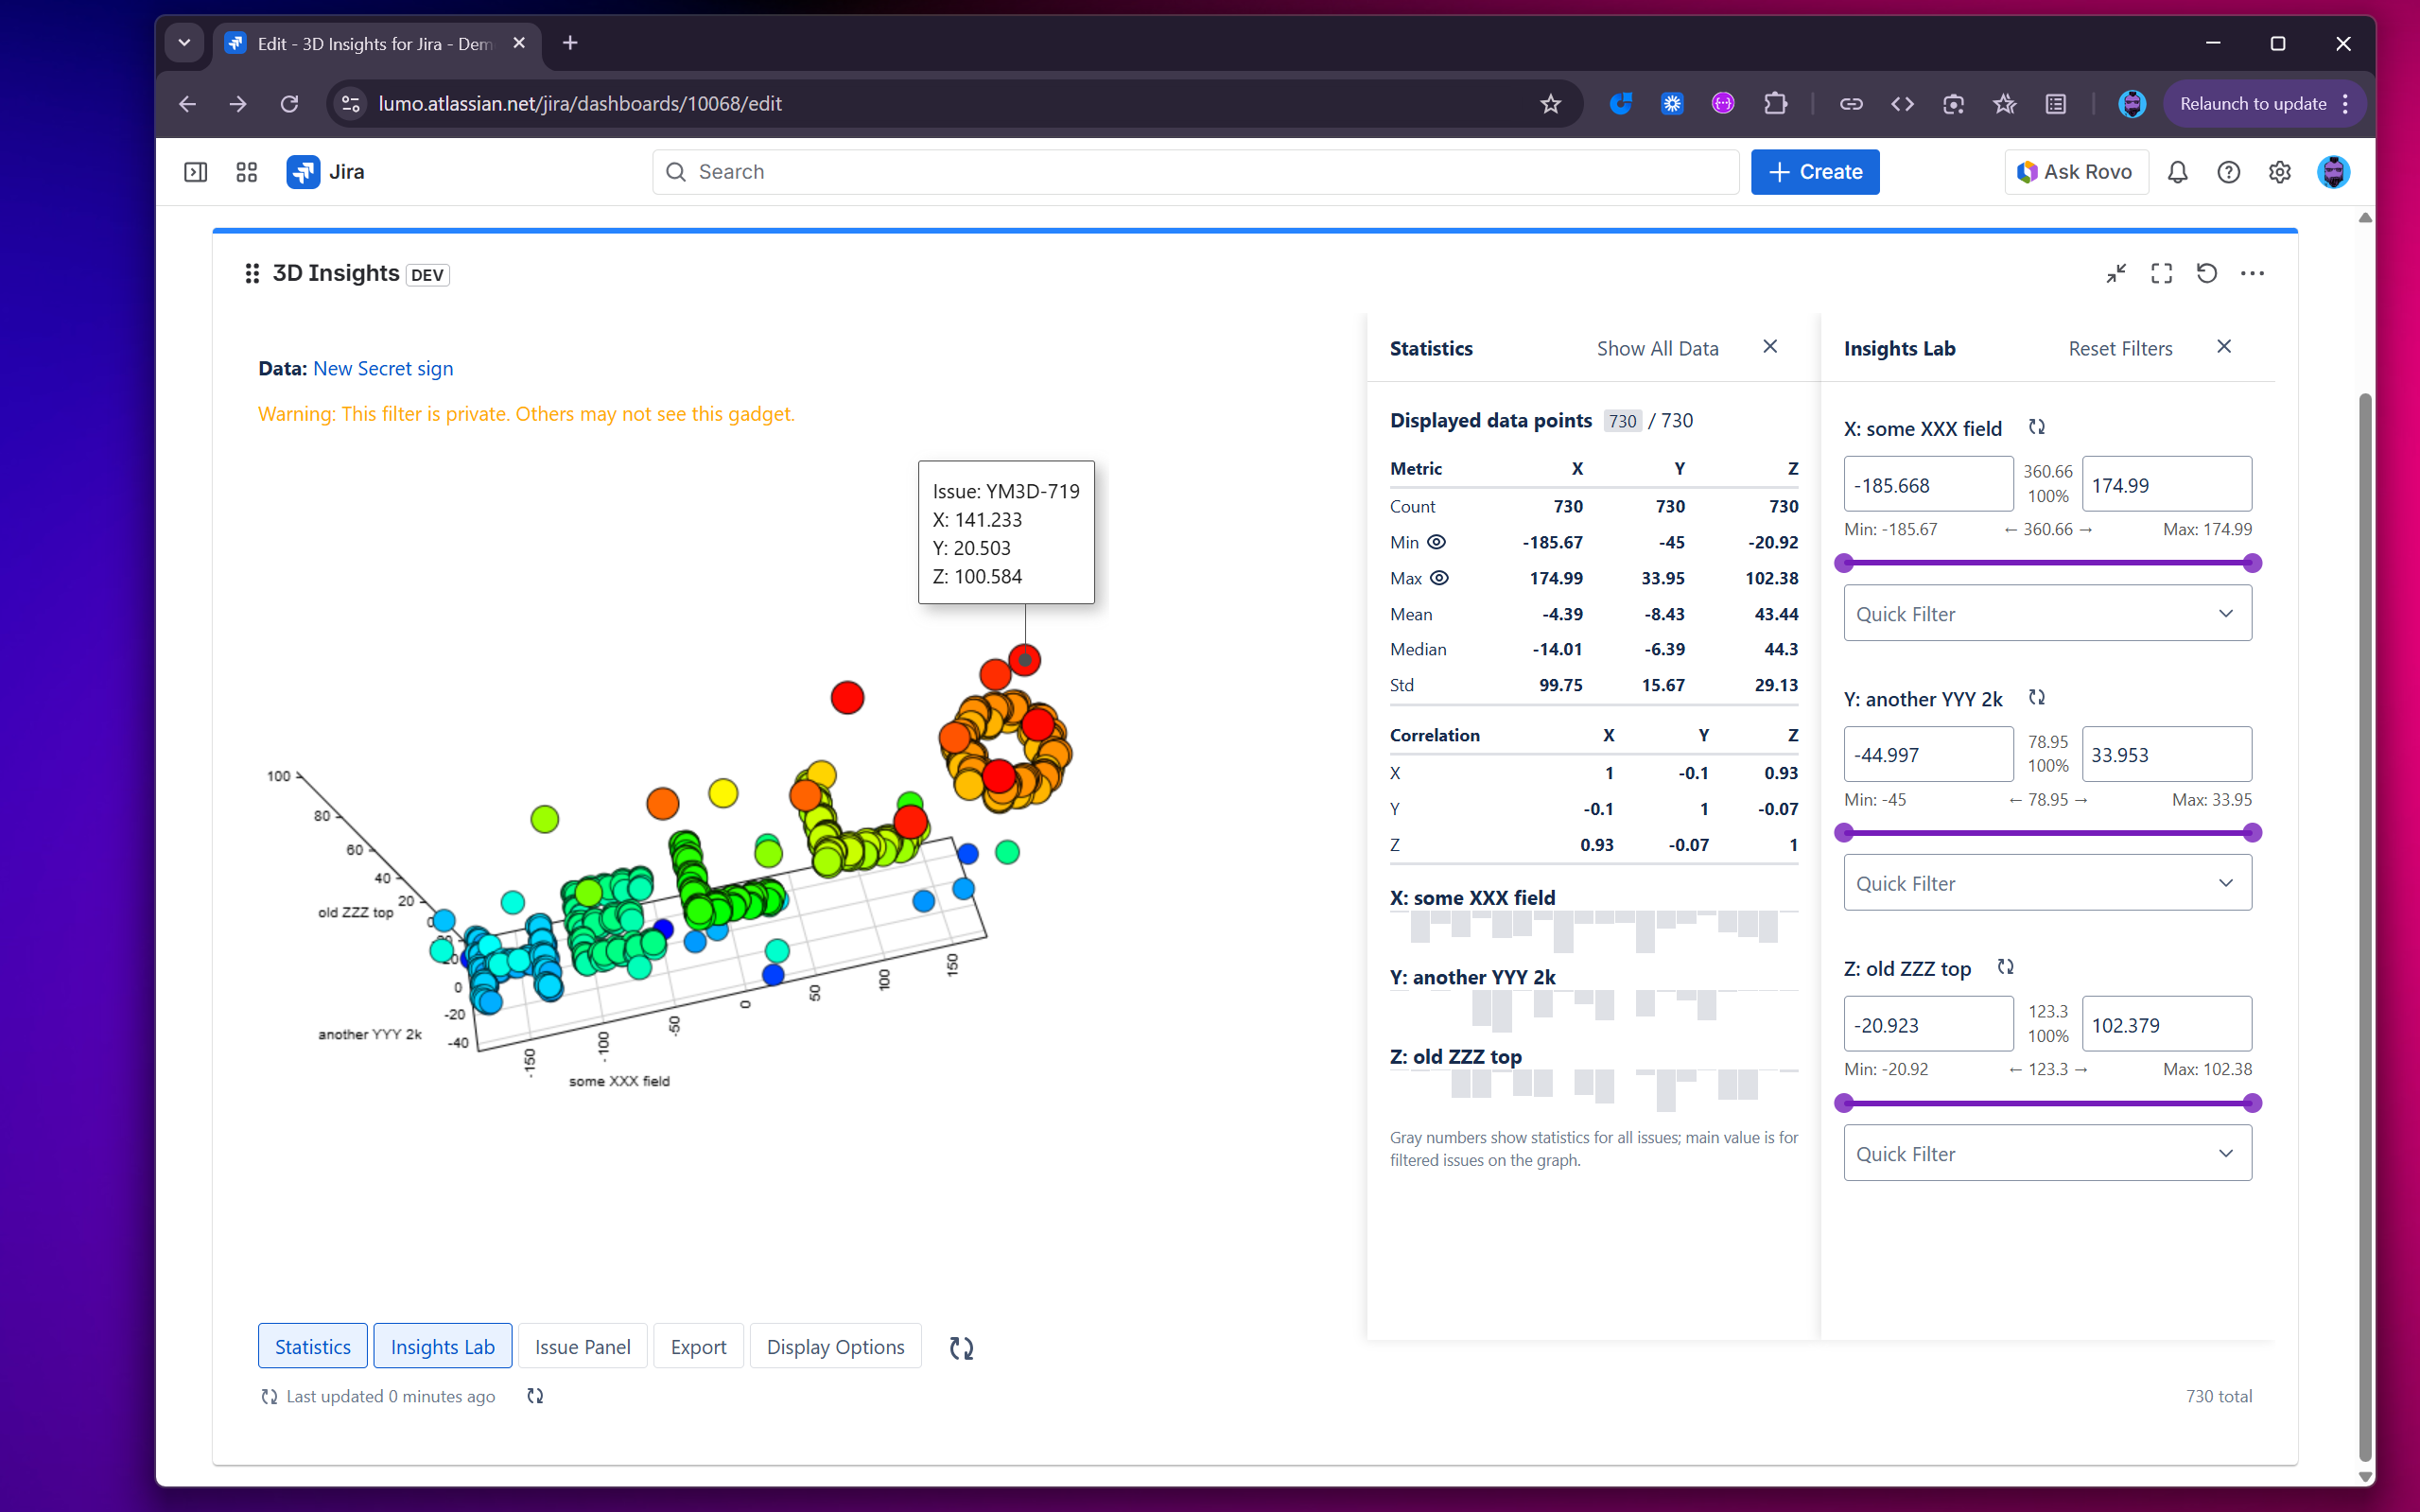
Visualize Jira issues in an interactive 3D chart
-

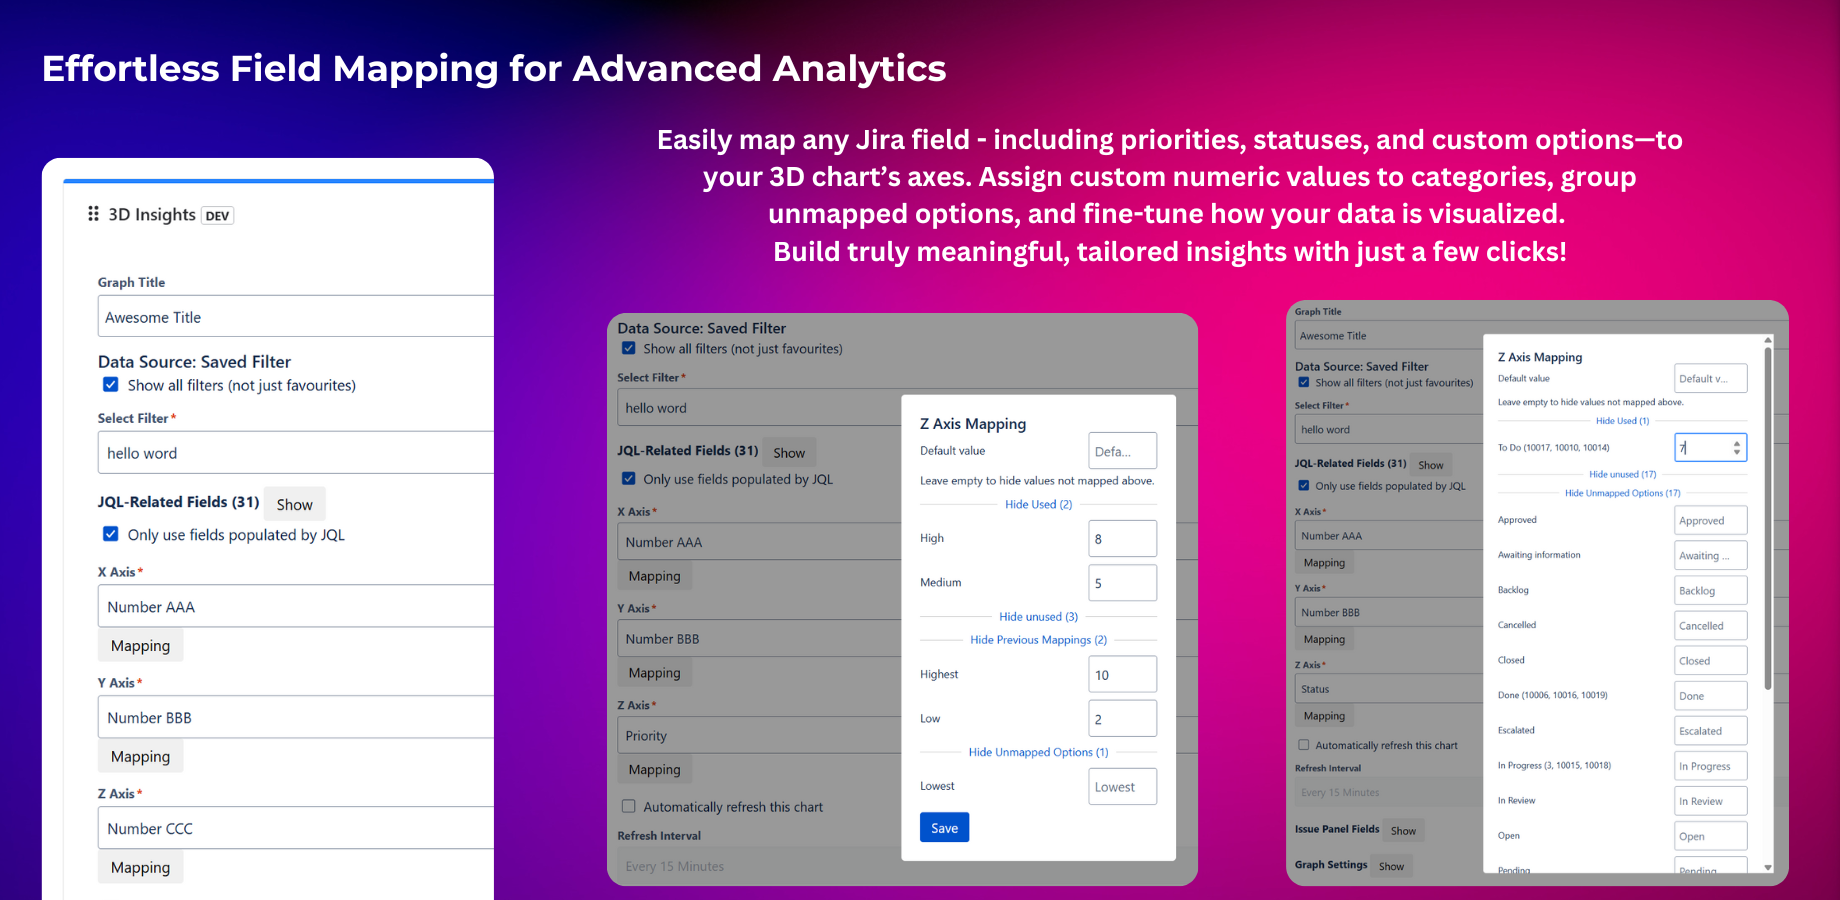
Flexible field mapping for 3D analytics
-
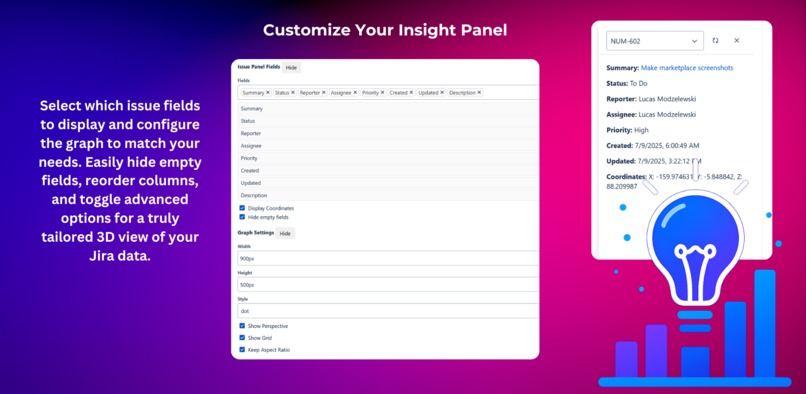
Customize your 3D chart and issue panel
-
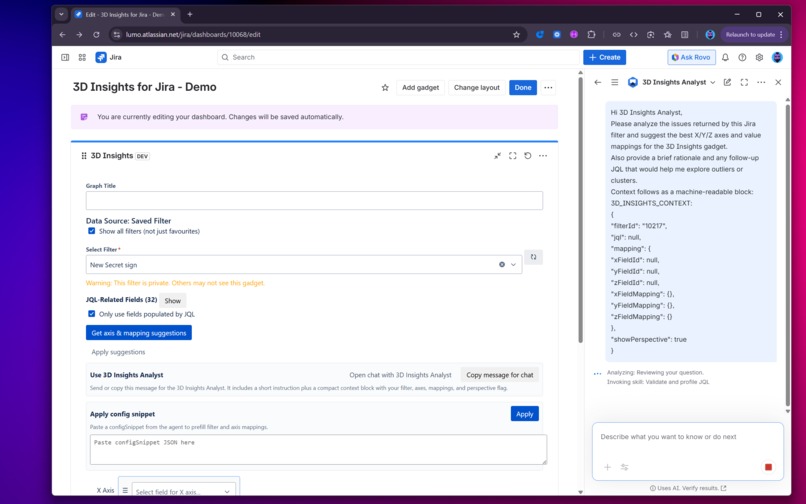
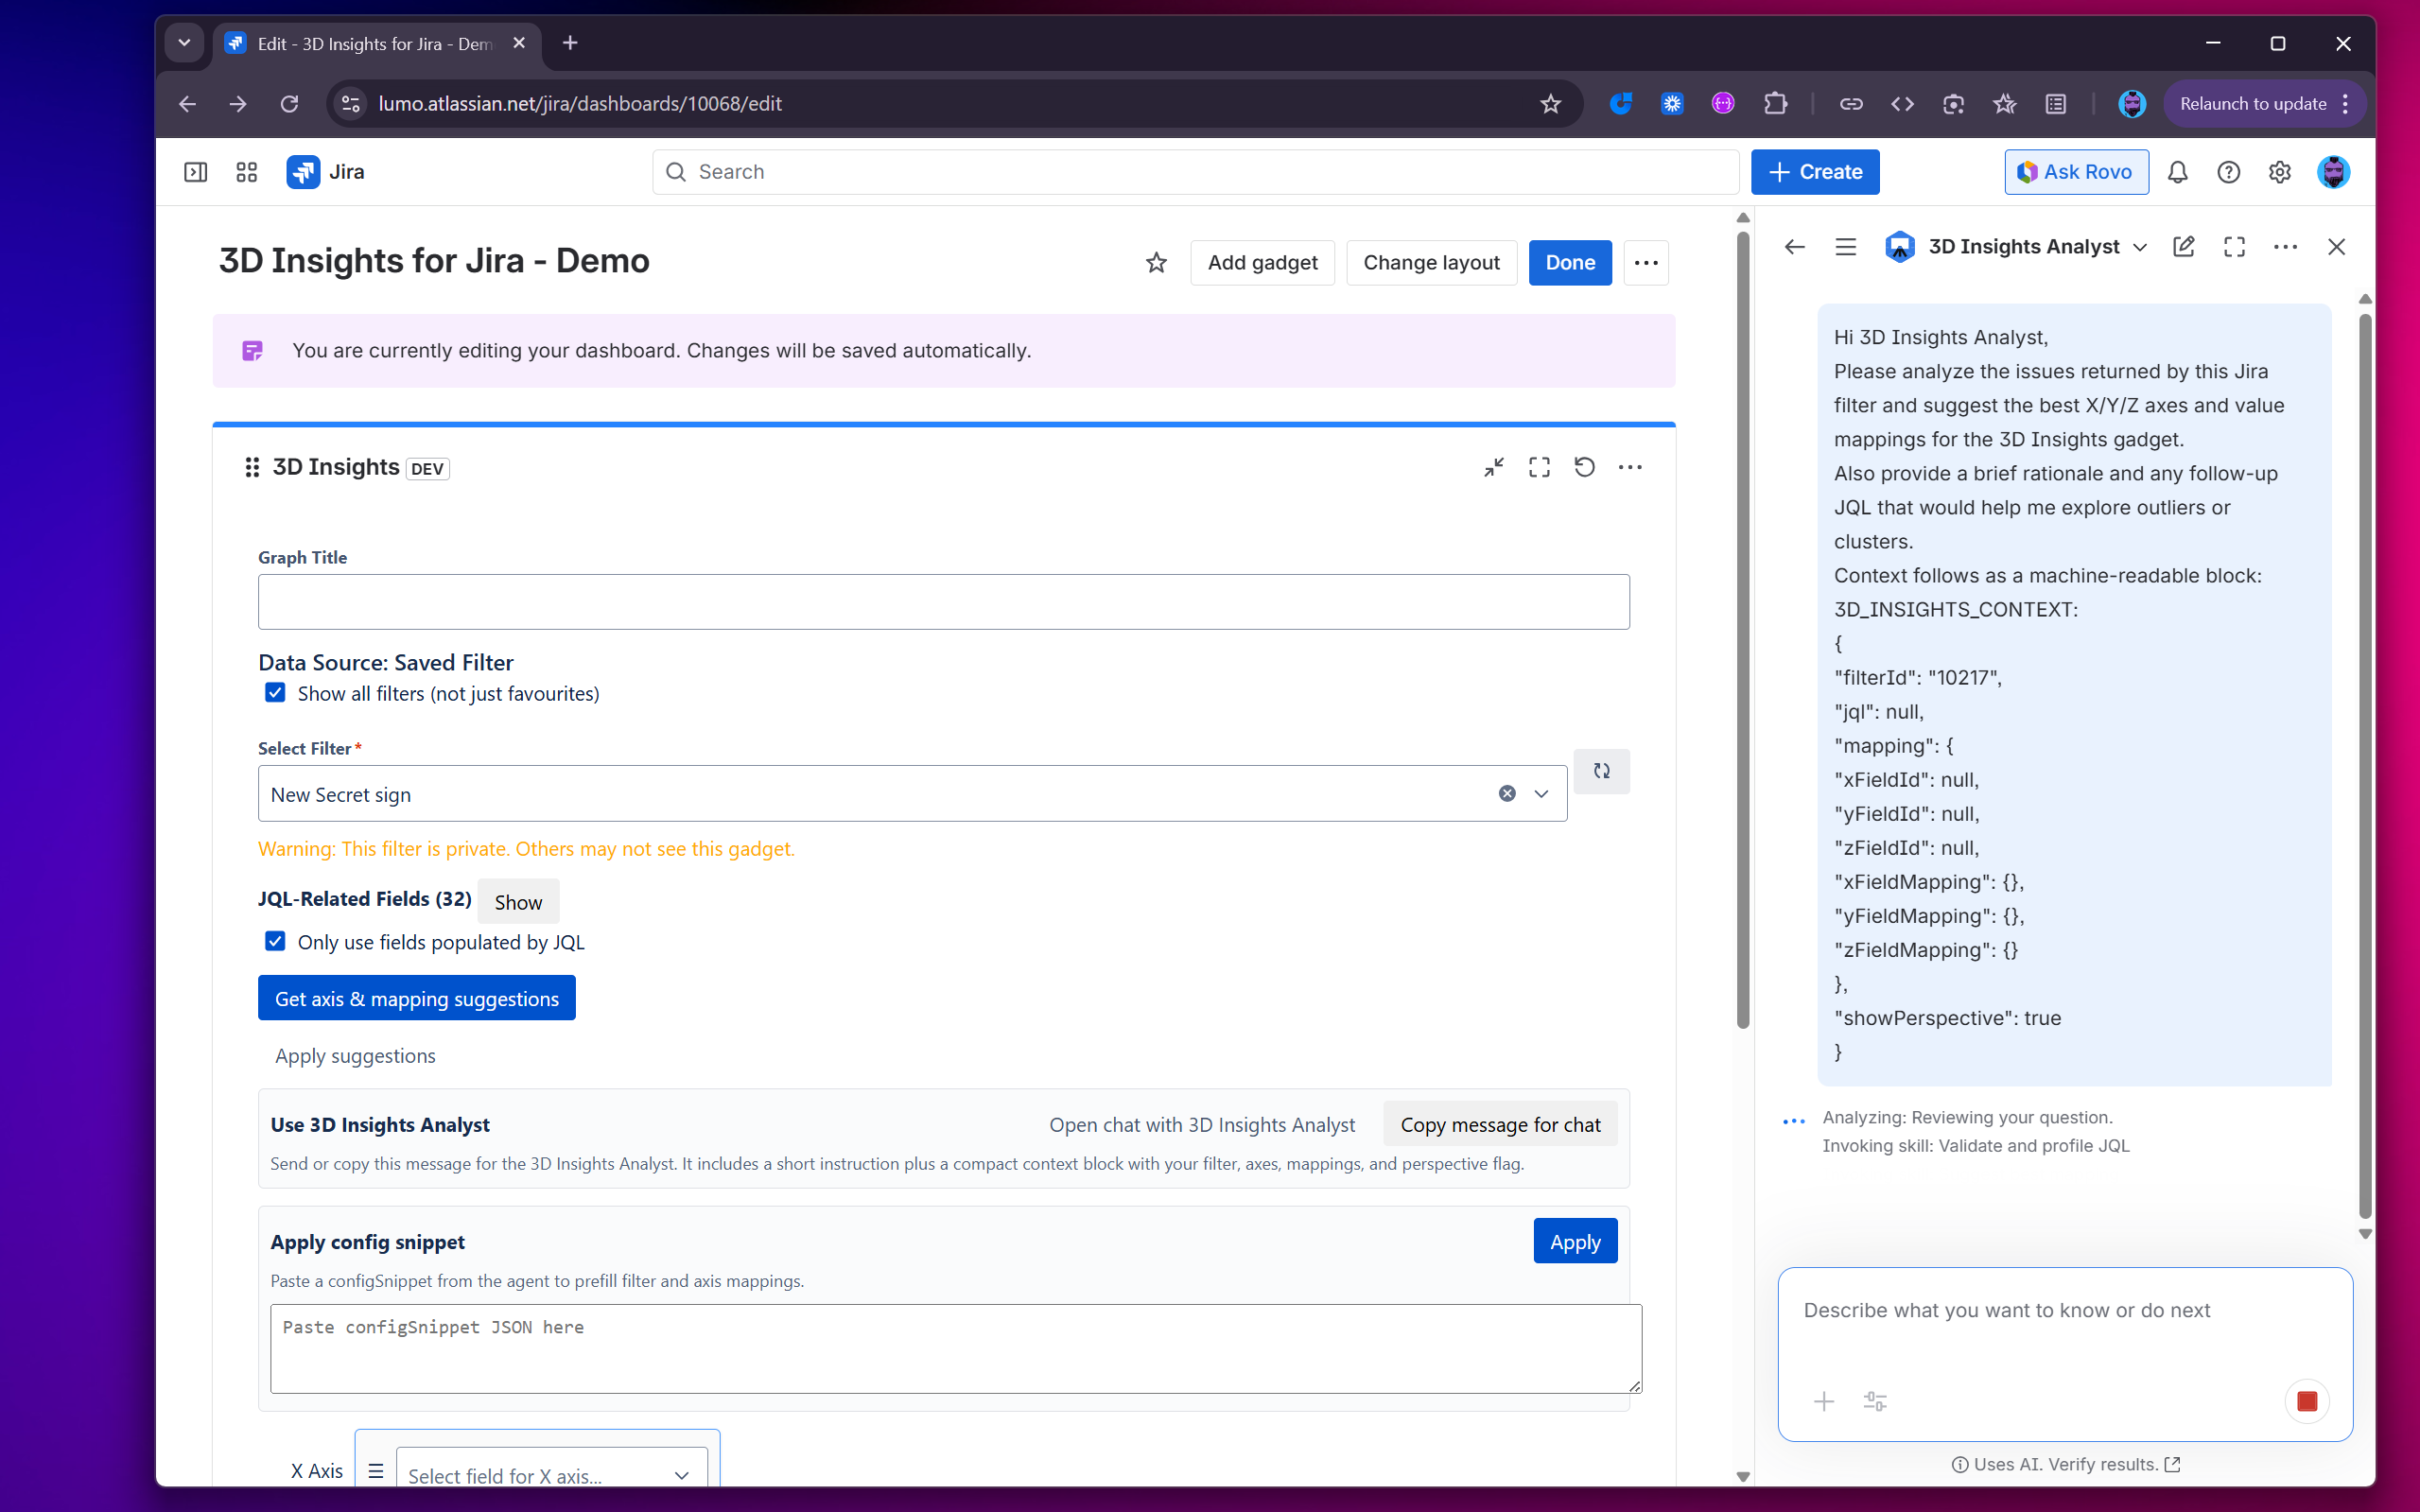
Invoked Agent: 3D Insights Analyst
-

Instant statistics & histograms


Inspiration
Teams struggle to “see” patterns in large Jira issue sets. Lists and 2D charts hide relationships, bottlenecks, and outliers - especially when fields are sparse or poorly distributed.
We wanted a fast, on-platform way to explore Jira data interactively, without exporting to spreadsheets or BI tools.
LLMs can help choose meaningful visualization dimensions - but only if they are guided by real data, strict heuristics, and clear explanations. Otherwise, you get pretty but misleading charts.
What it does
3D Insights for Jira adds a 3D dashboard gadget that helps teams explore Jira issues across three meaningful dimensions.
- Visualizes Jira issues on X/Y/Z axes directly in a dashboard gadget
- Uses a Rovo agent to suggest optimal axes and mappings by:
- Prioritizing numeric fields with real variance (not flat or zero-only)
- Selecting categorical fields with diversity (not single-bucket)
- De-prioritizing dates unless explicitly requested
- Validates JQL, profiles field coverage and distribution, and explains:
- why certain fields were chosen
- why others were skipped (e.g. “no spread”, “insufficient coverage”)
- One-click Apply suggestions in the gadget editor - no copy/paste, no context switching
- Optional chat for narratives and alternative perspectives, with:
- strict JSON outputs for configs
- explanations kept outside structured data
- safe, permission-aware Jira access
How we built it
Platform
- Atlassian Forge app with a Jira dashboard gadget
- Rovo agent integrated via Forge agent and action modules
Backend
- JQL validation and field discovery via Jira REST API
- Sampling with requested fields (
*all) and defensive limits - Heuristics for:
- numeric spread detection
- categorical diversity
- coverage thresholds (95% with a safe 90% fallback)
- Storage-backed suggestion flow (per gadget, per axis)
Frontend
- React-based gadget UI with Edit and View modes
- Non-breaking Apply suggestions button that pre-fills mappings from storage
- Optional “Open chat” entry point with compact context
Safety and correctness
- All Jira reads respect user permissions
- Sanitization on both backend and frontend
- Deterministic heuristics drive suggestions
- AI explanations are grounded in measured data, not guesses
Challenges we ran into
- Field variability - Jira instances differ wildly and custom fields are often sparse
- Solved by auto-discovering numeric fields and enforcing spread and diversity checks
- Avoiding “pretty but empty” axes - 100% coverage can still be useless
- Flat distributions are detected and skipped
- UX without copy/paste - chat alone wasn’t enough
- Added storage-backed Apply suggestions that works even without chat
- Balancing guidance with control
- Users can override suggestions; we warn but never block
Accomplishments that we’re proud of
- Meaningful defaults - most visualizations work on the first try
- Clear explanations - users see exactly why fields were chosen or skipped
- Non-breaking enhancements - everything is additive and opt-in
- True Jira-native workflow - no exports, no external tools, no context switching
What we learned
- Coverage alone is not enough - variance and category distribution matter more for visualization
- Explainability builds trust - users accept AI suggestions when reasons are explicit
- Small UX touches (like Apply suggestions) dramatically improve adoption
What’s next for 3D Insights for Jira
- Configurable thresholds (coverage, spread) and per-team presets
- Optional advanced date binning when time axes are requested
- Auto-detected insight patterns (clusters, bottlenecks) with drill-down links
- Bulk apply suggestions across dashboards and filters with safe previews
- Opt-in, privacy-first telemetry to improve recommendations
- Support for Assets


Log in or sign up for Devpost to join the conversation.