-
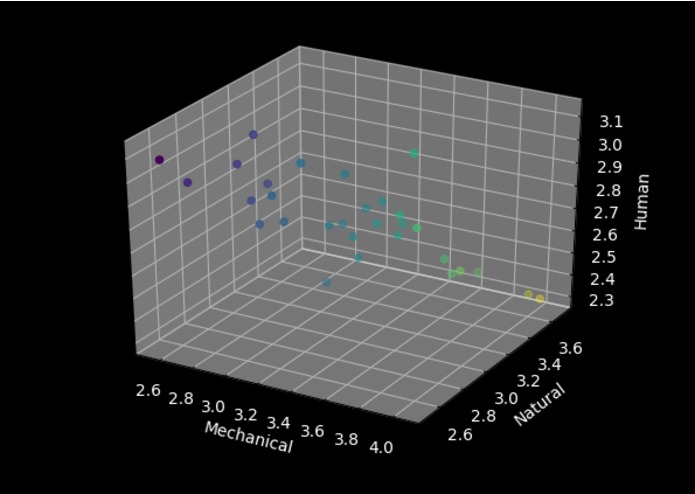
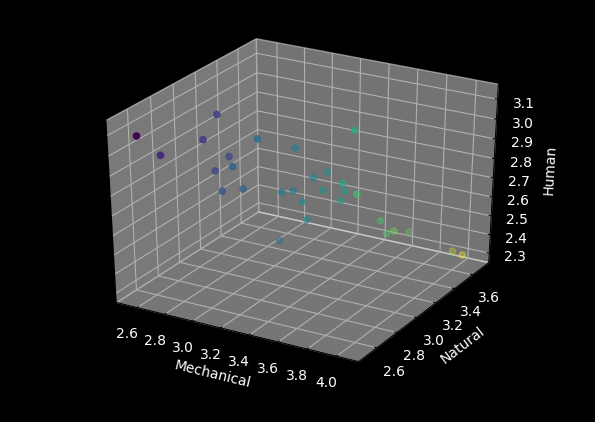
it moves around and axises are customizeable, but this is a one possible graph in one possible position
Inspiration
I'm doing some research about music perception and AI, and wanted to make a cool graph. It's very uncomplicated, but I'm into snazzy graphs.
What it does
create a 3d graph with dimensions according to user input
How I built it
Well, I just cleaned the data in SAS and excel and made a graph with Python
Challenges I ran into
Formatting between languages proved to be more awkward than I anticipated.
Accomplishments that I'm proud of
Now I have a template for snazzy 3d graphs
What I learned
a lot about matplotlib and programming in general.
What's next for 3d Graph for Research Project
Need to do analyses on data and revisualize including the most important variable: Whether or not excerpt was actually written by Kulitta or Bach

Log in or sign up for Devpost to join the conversation.