Project Story
Inspiration
As geology students, we live with a constant tension: geological maps are everywhere, but 3D models are hard to get. Paper and scanned maps capture decades of field work, yet turning them into subsurface models still often means days of manual digitizing and expensive commercial software (GOCAD, Leapfrog, and the like).
Our university innovation project—Intelligent 3D Geological Modeling from Planar Maps (geo3d_project)—started from a simple question:
Can we go from a 2D planar geological map to a usable 3D geological model with open tools, so students and small teams are not locked out?
We were also motivated by the huge archive of historical maps: if even a semi-automatic path exists, those “flat” archives become living 3D knowledge.
What We Built
We split the problem into two stages that share one data contract.
Stage A — Map information extraction (prototype)
From scanned color maps we built a Gradio-based pipeline:
- Optional MeanShift smoothing
- Black-line (boundary) masking
- LAB color clustering (KMeans / Auto-K)
- Contour extraction and CSV export
This proved that “map → structured coordinates” is possible, but also showed hard limits of pure color clustering (scan quality, patterns, text, and black-and-white maps with no color).
Stage B — 3D modeling (working end-to-end)
While extraction is still being hardened, we decoupled modeling so the backend could be validated first:
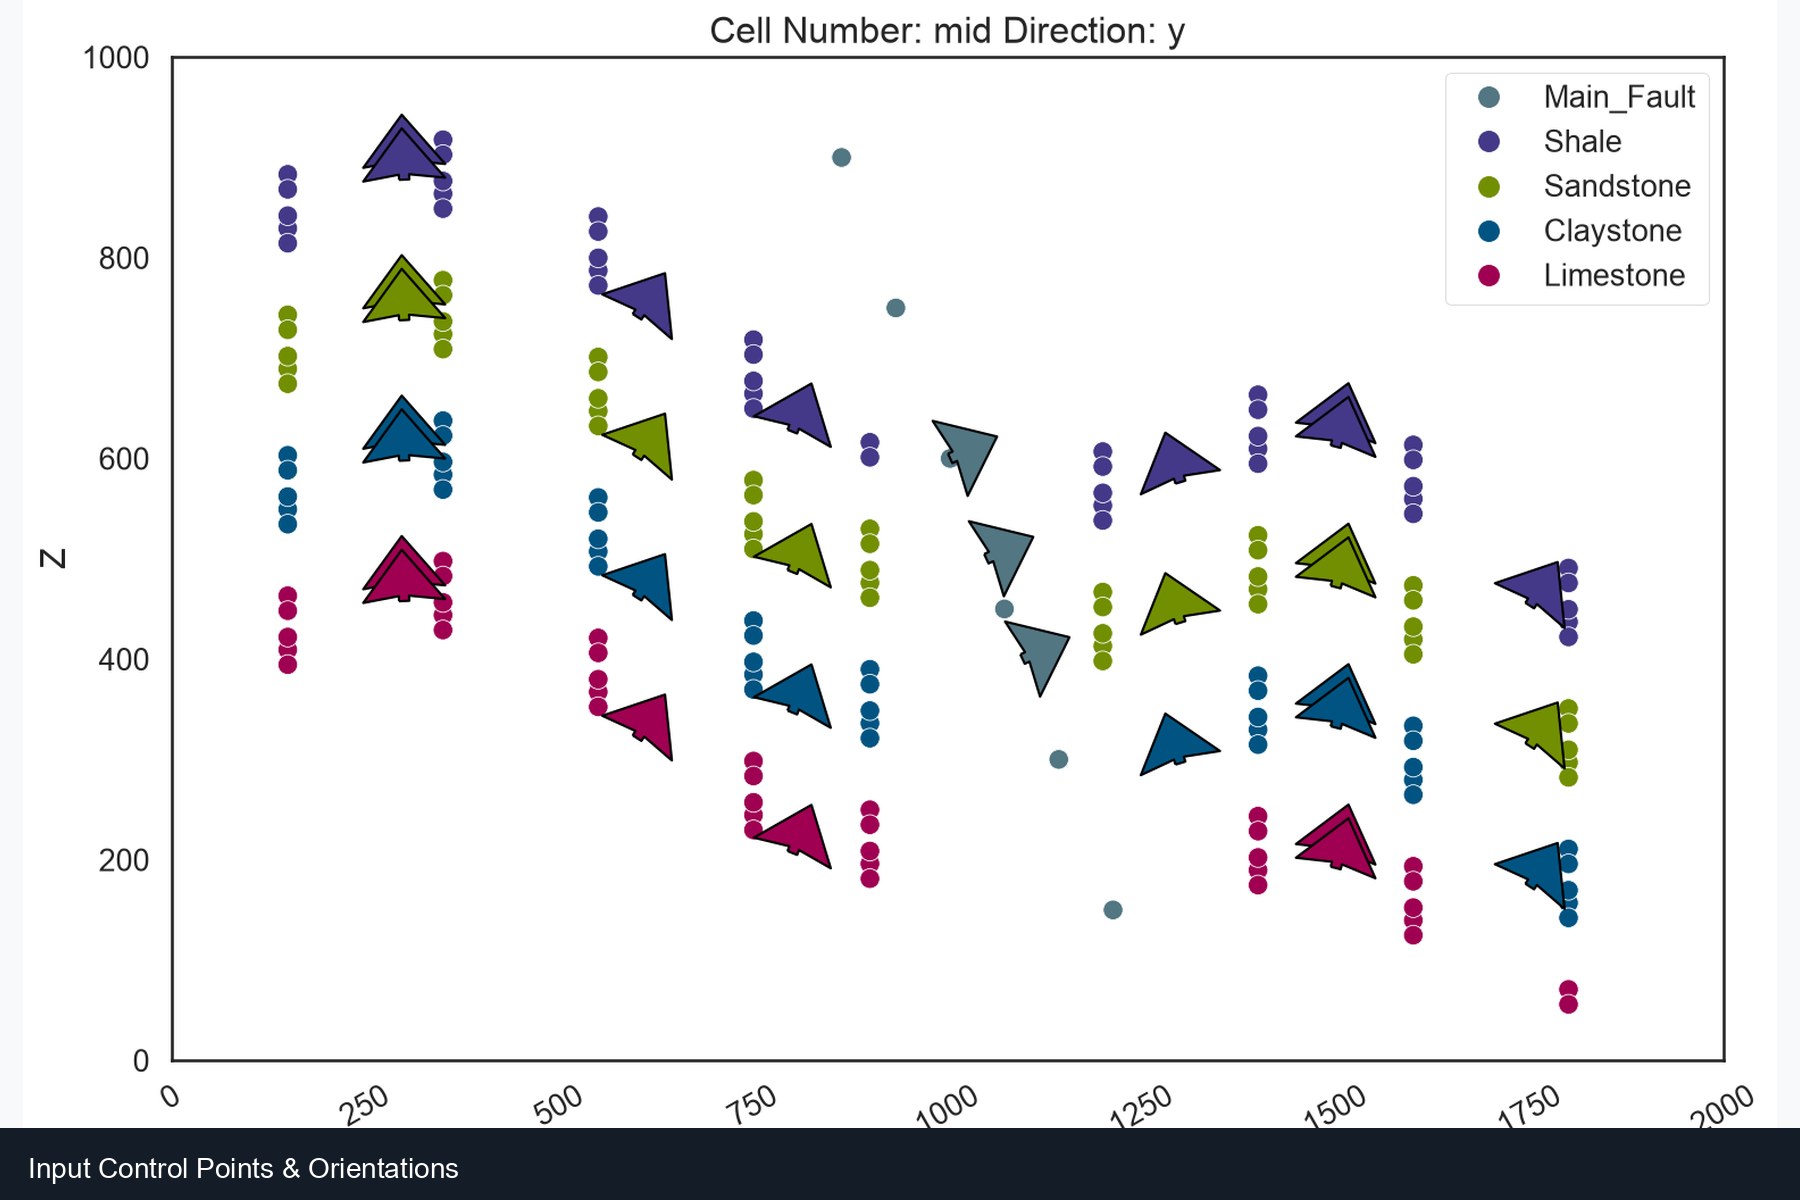
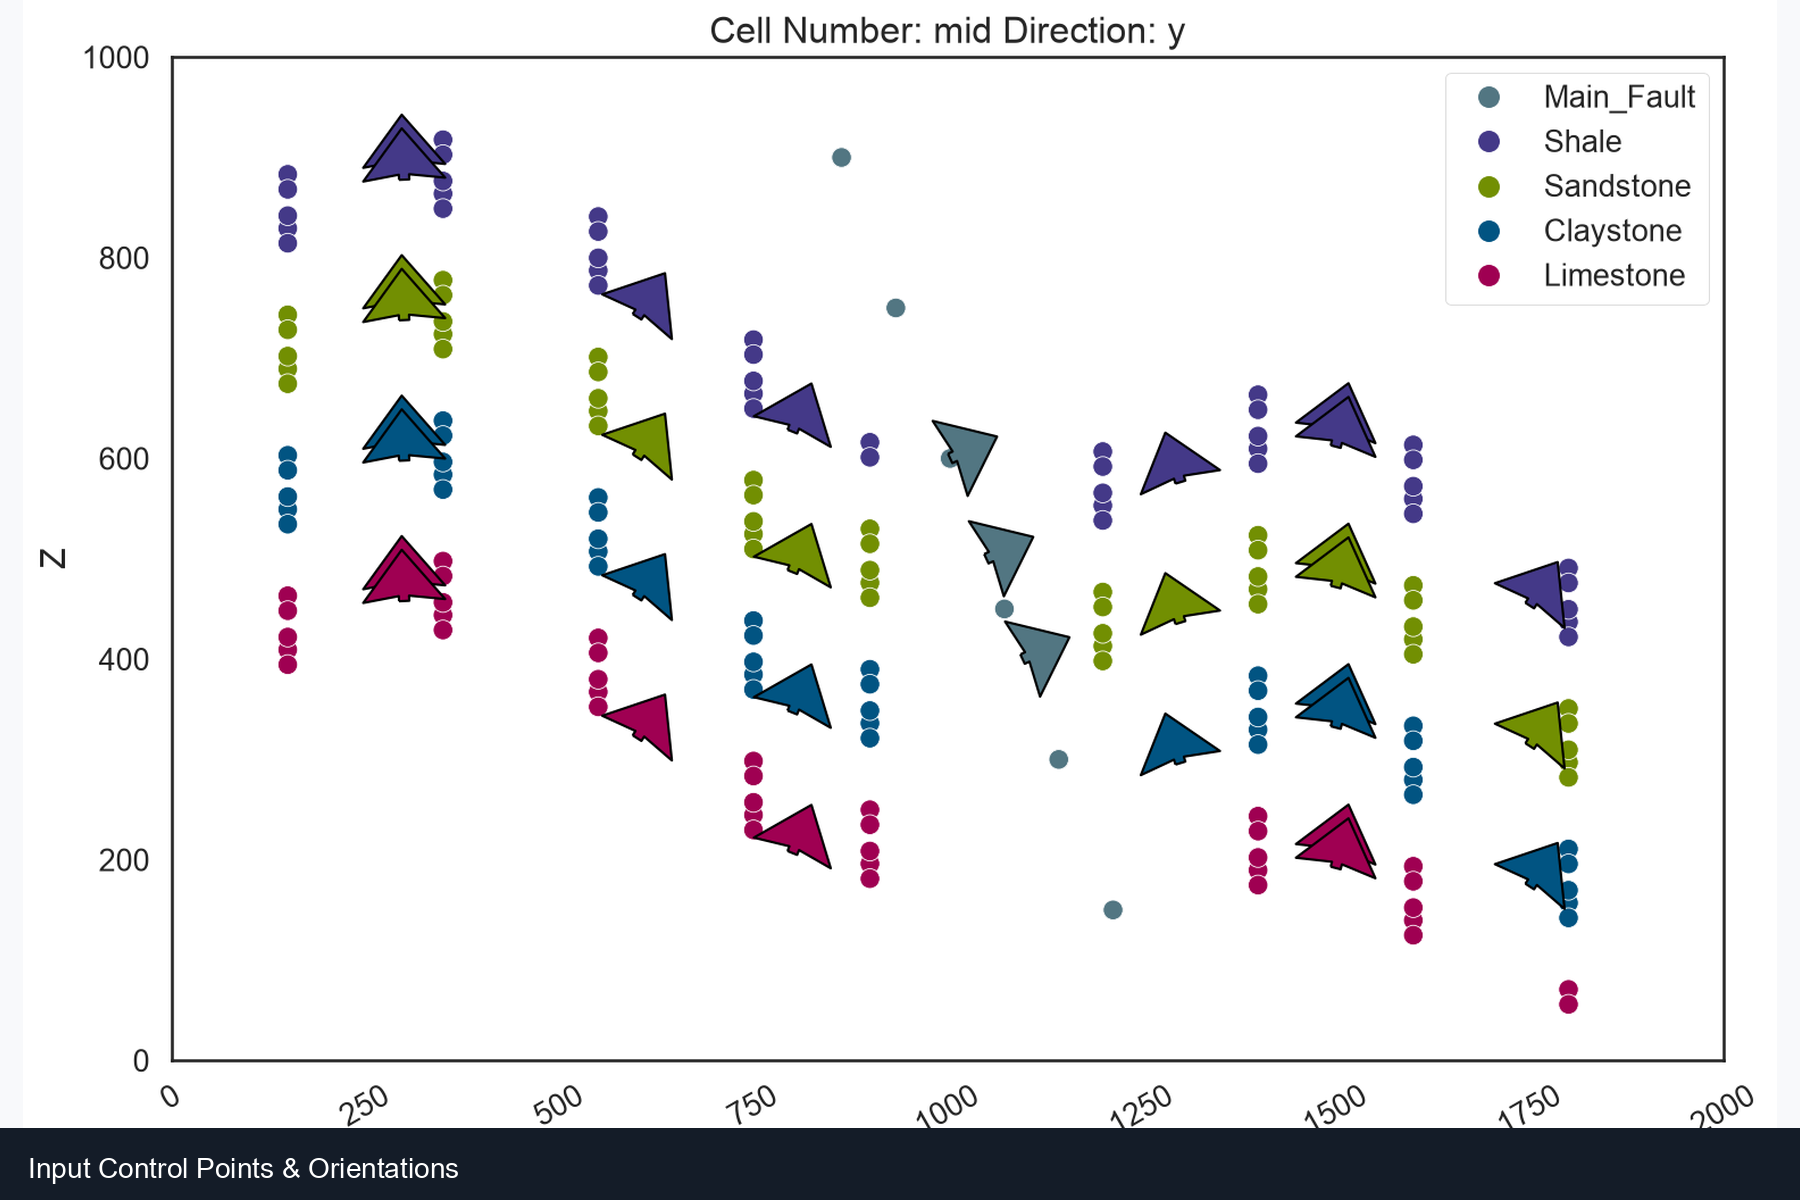
surface_points.csv + orientations.csv
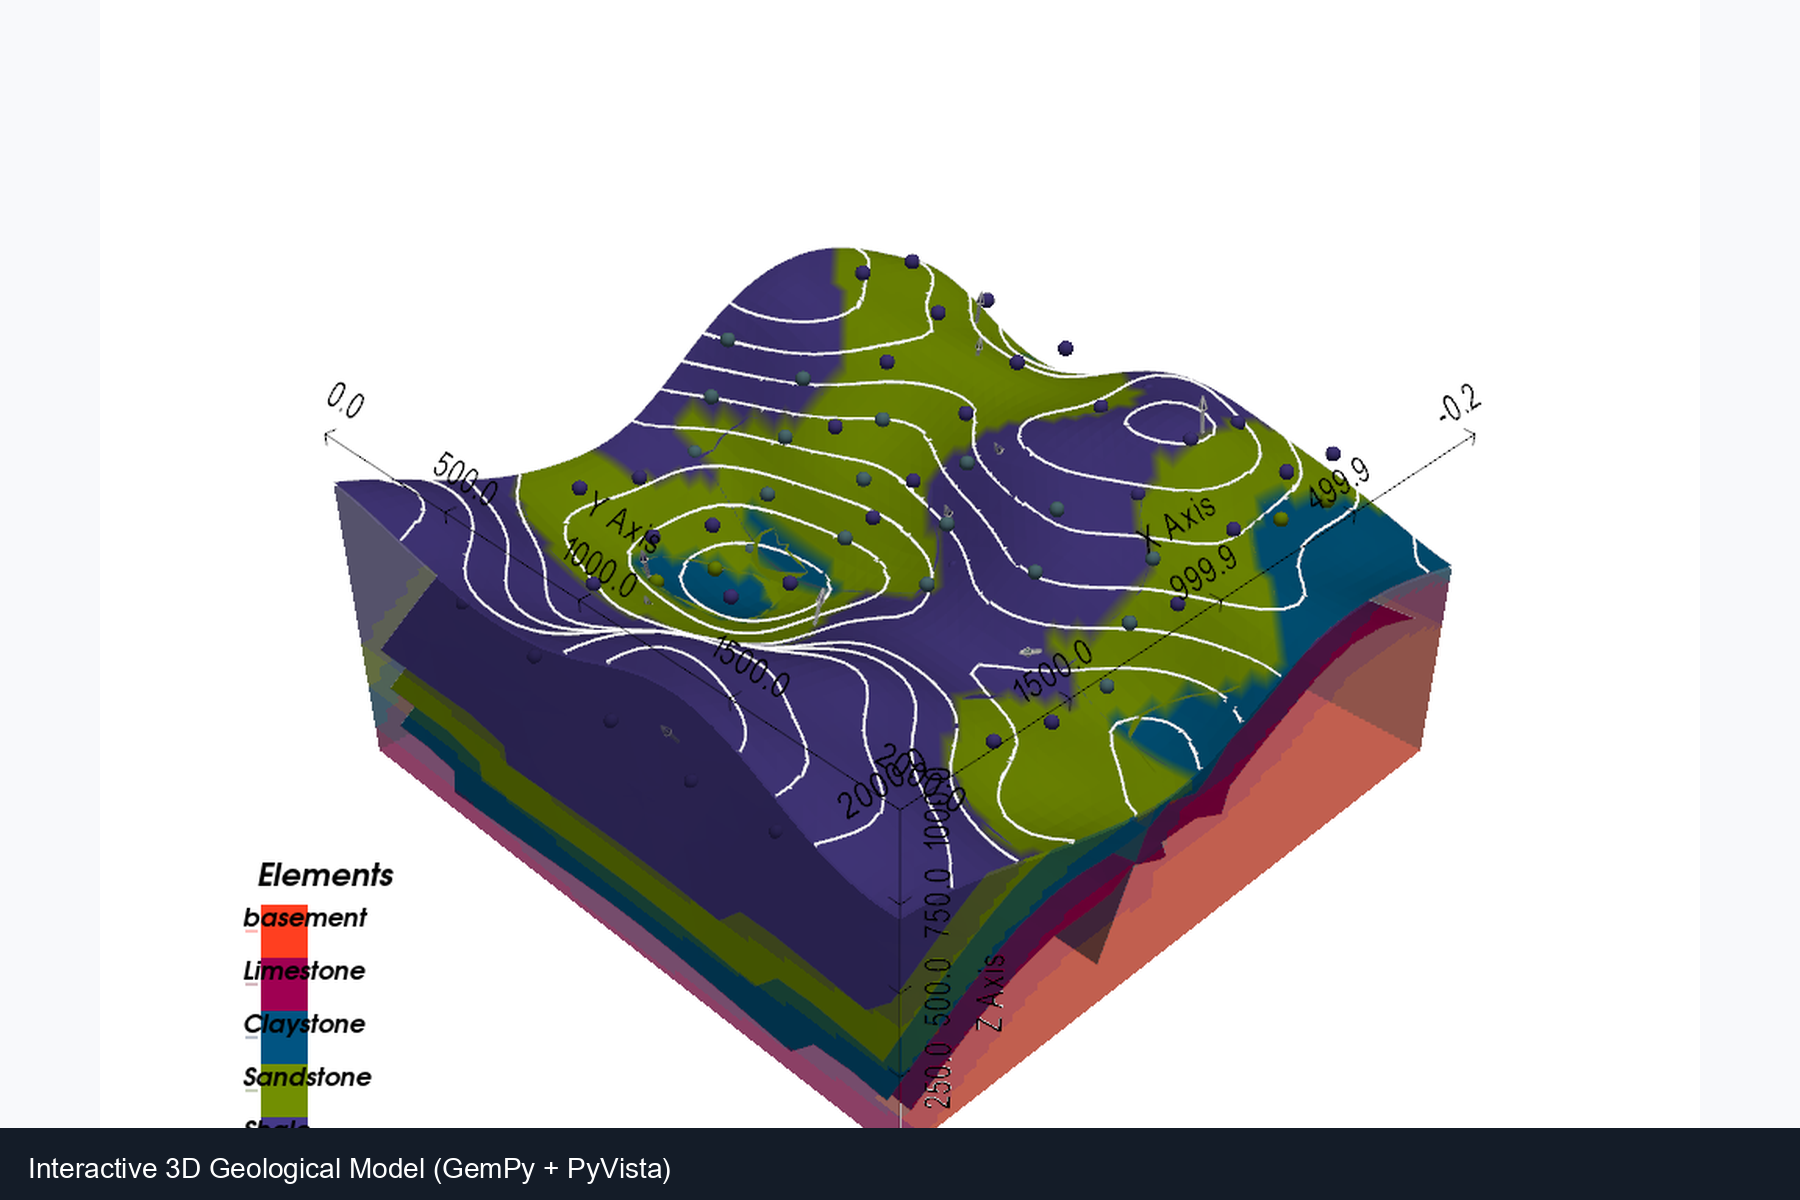
        → GemPy (implicit modeling)
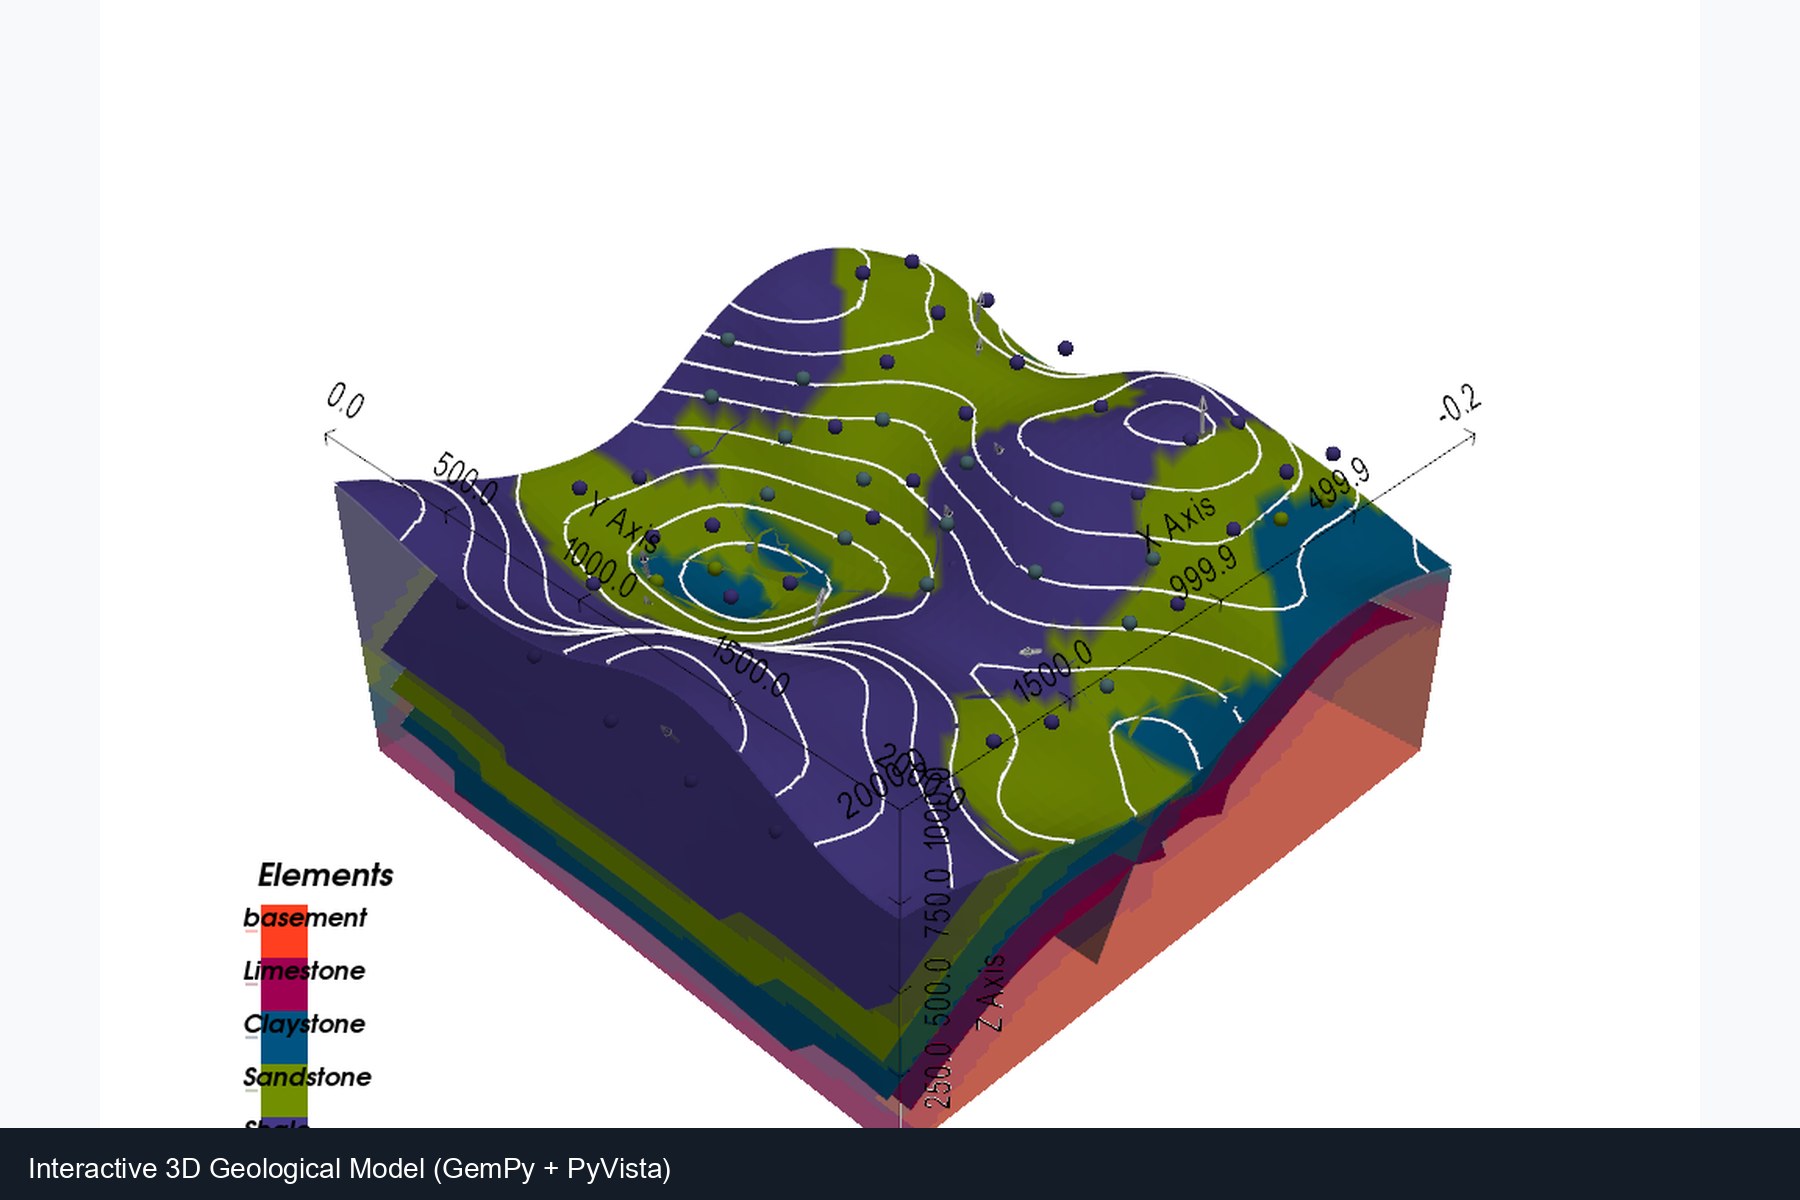
        → gempy_viewer + PyVista
        → interactive model_3d.html
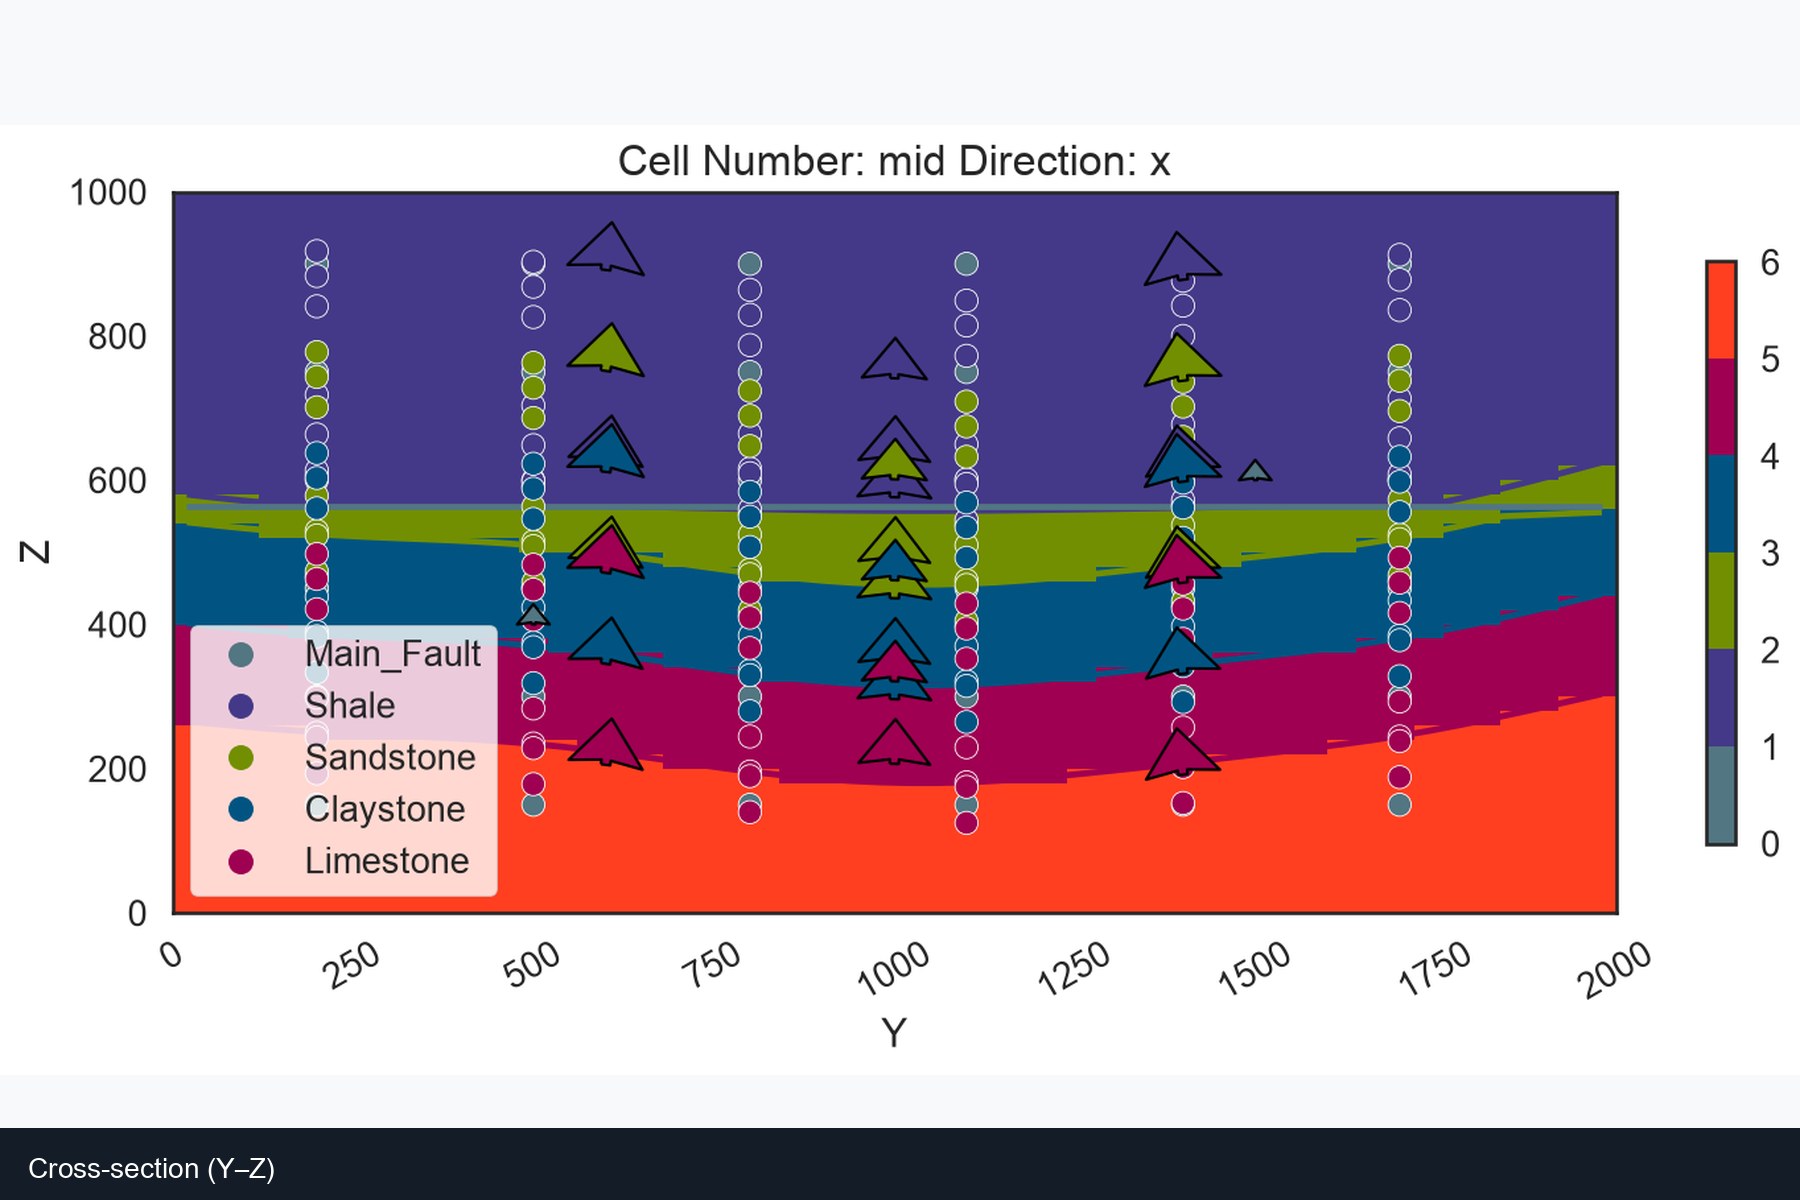
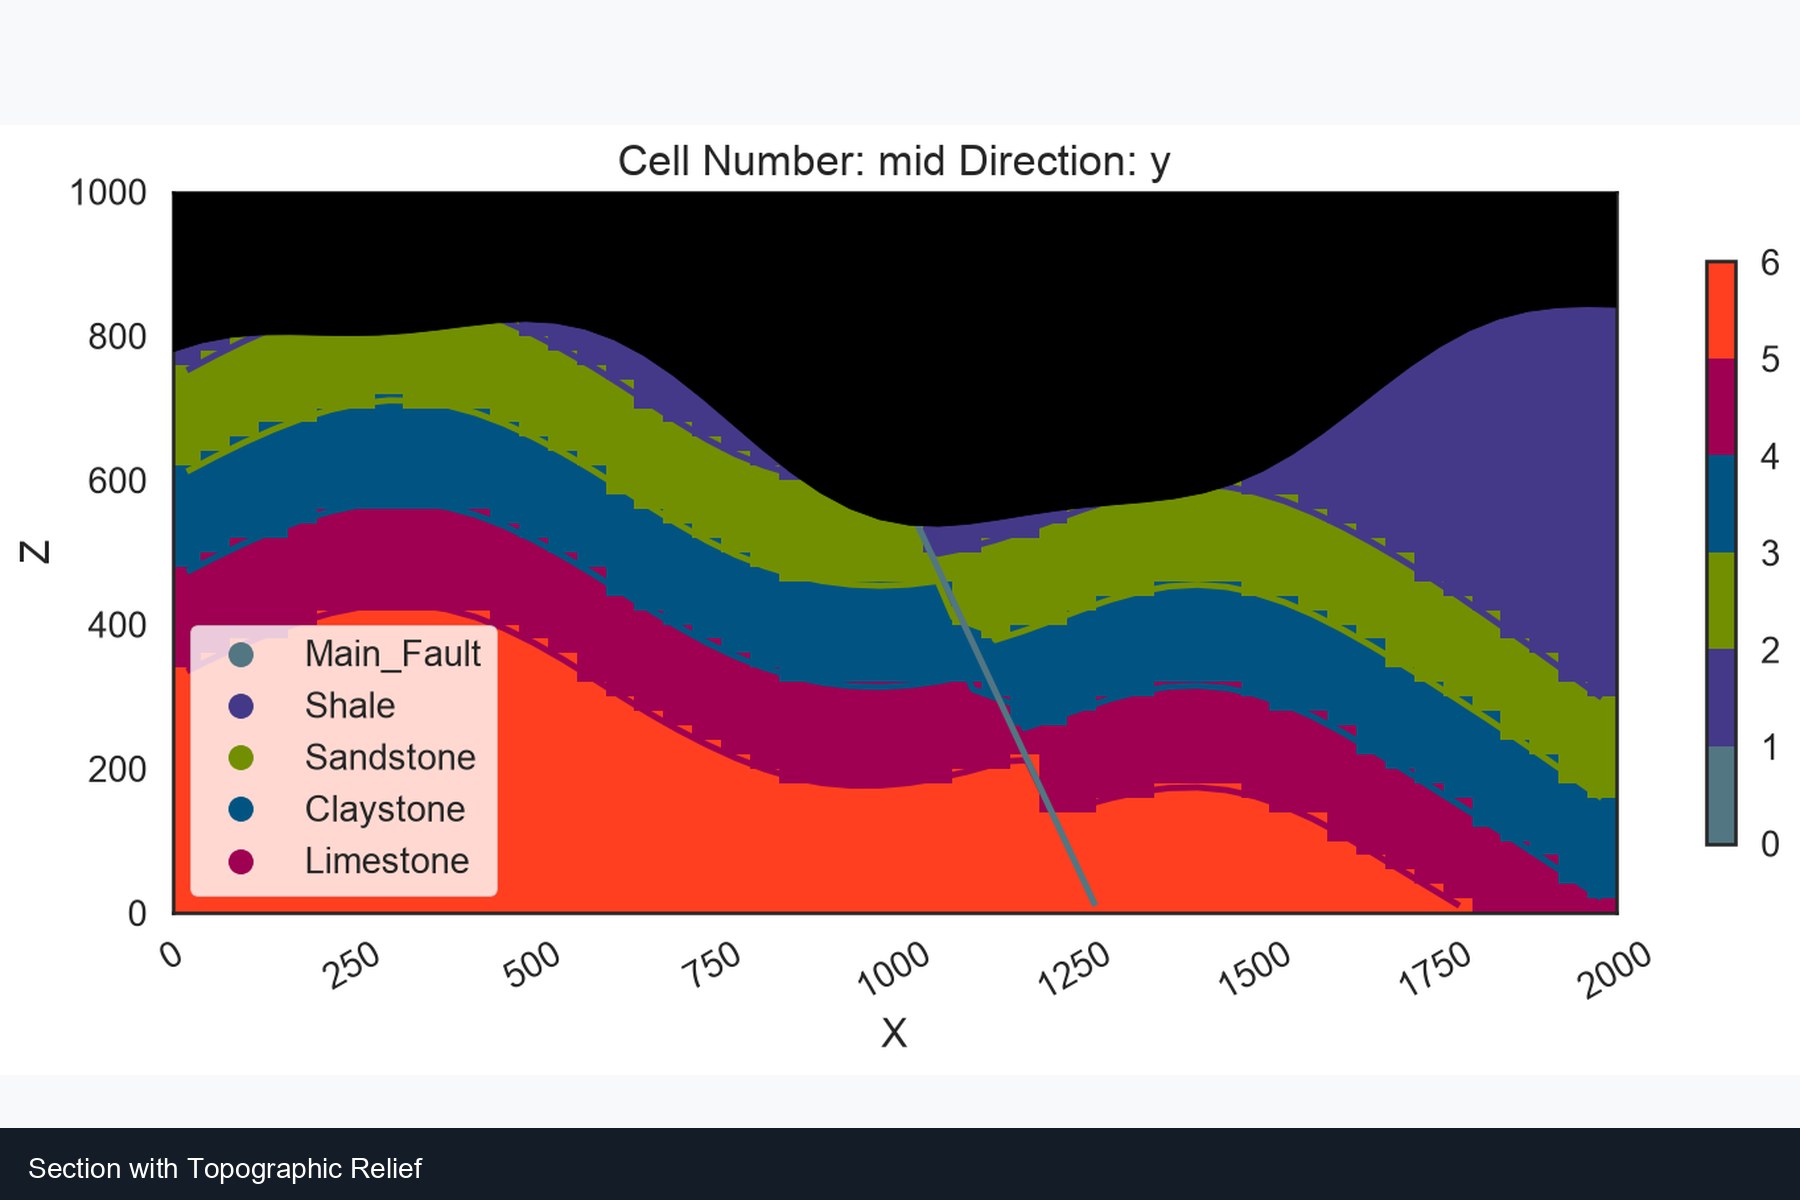
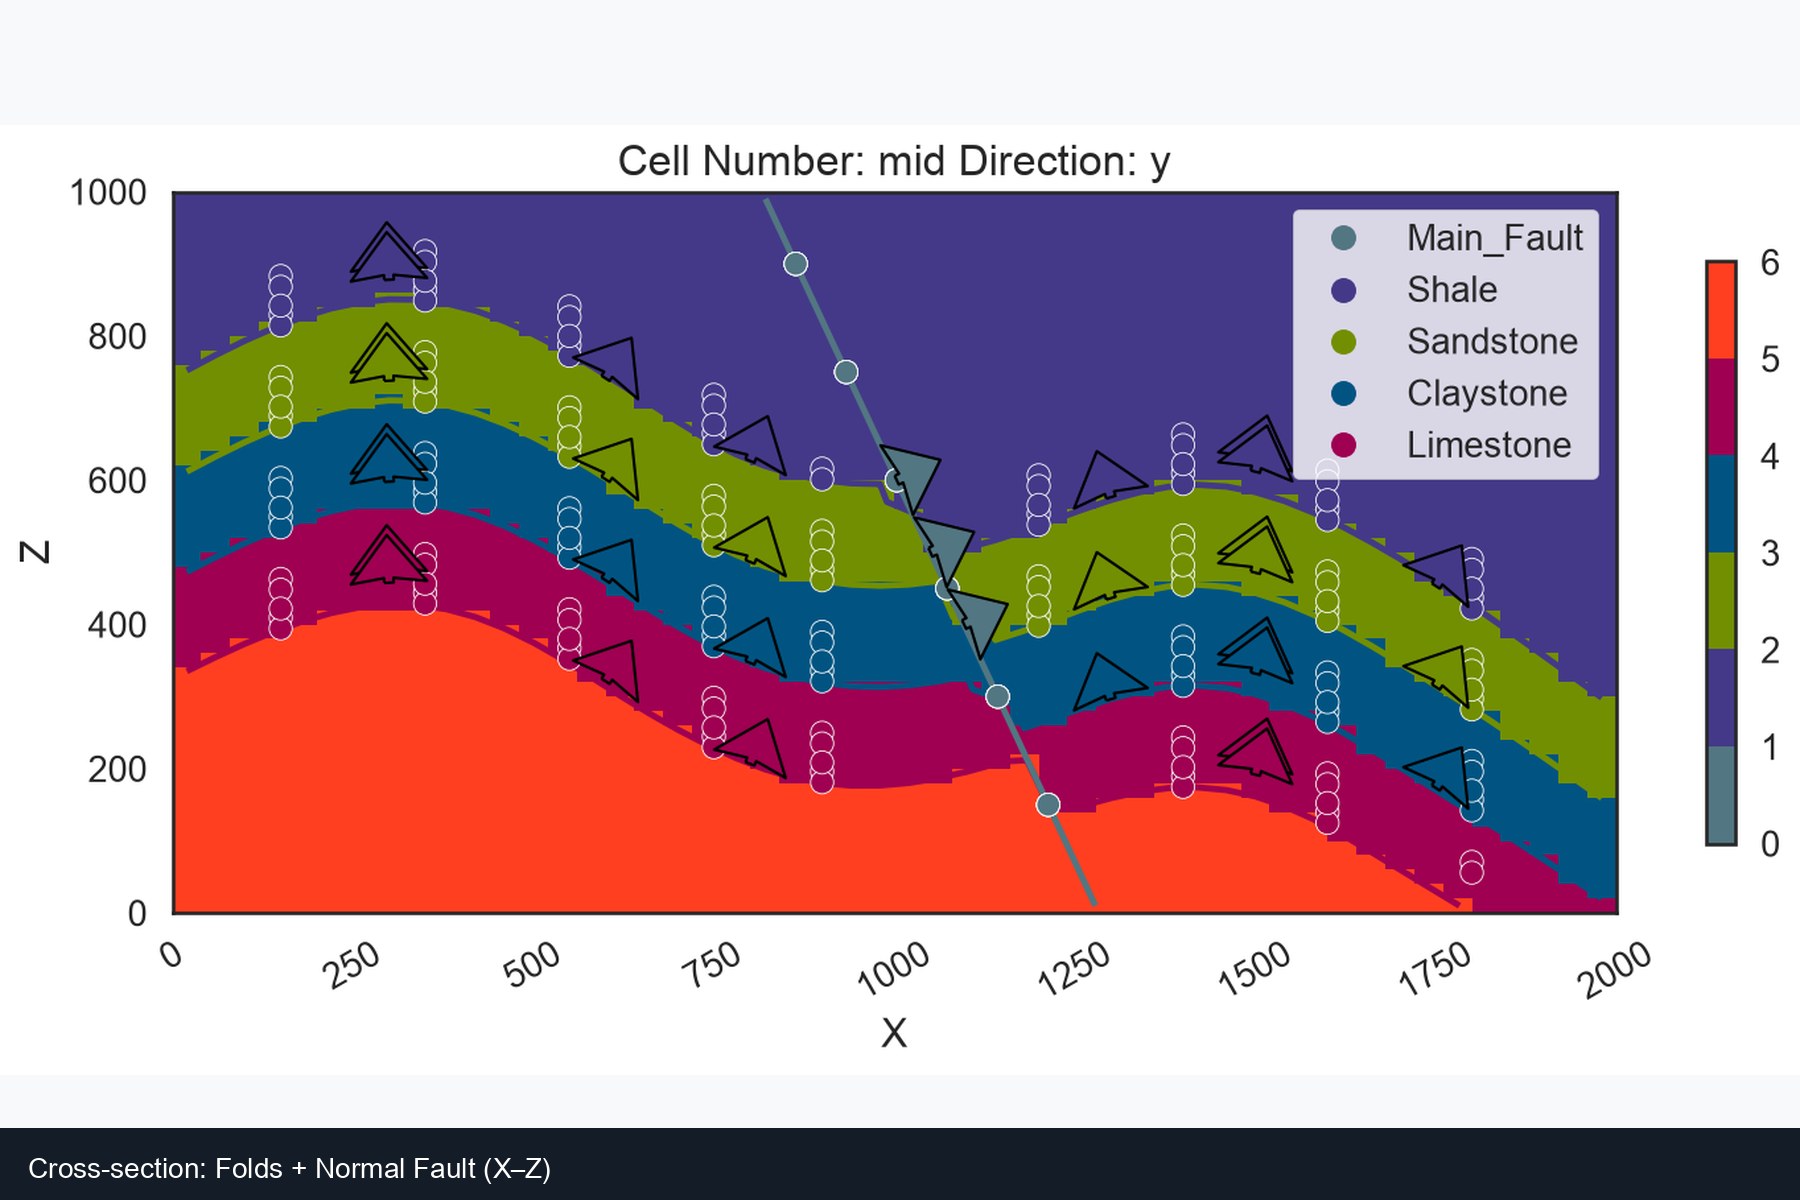
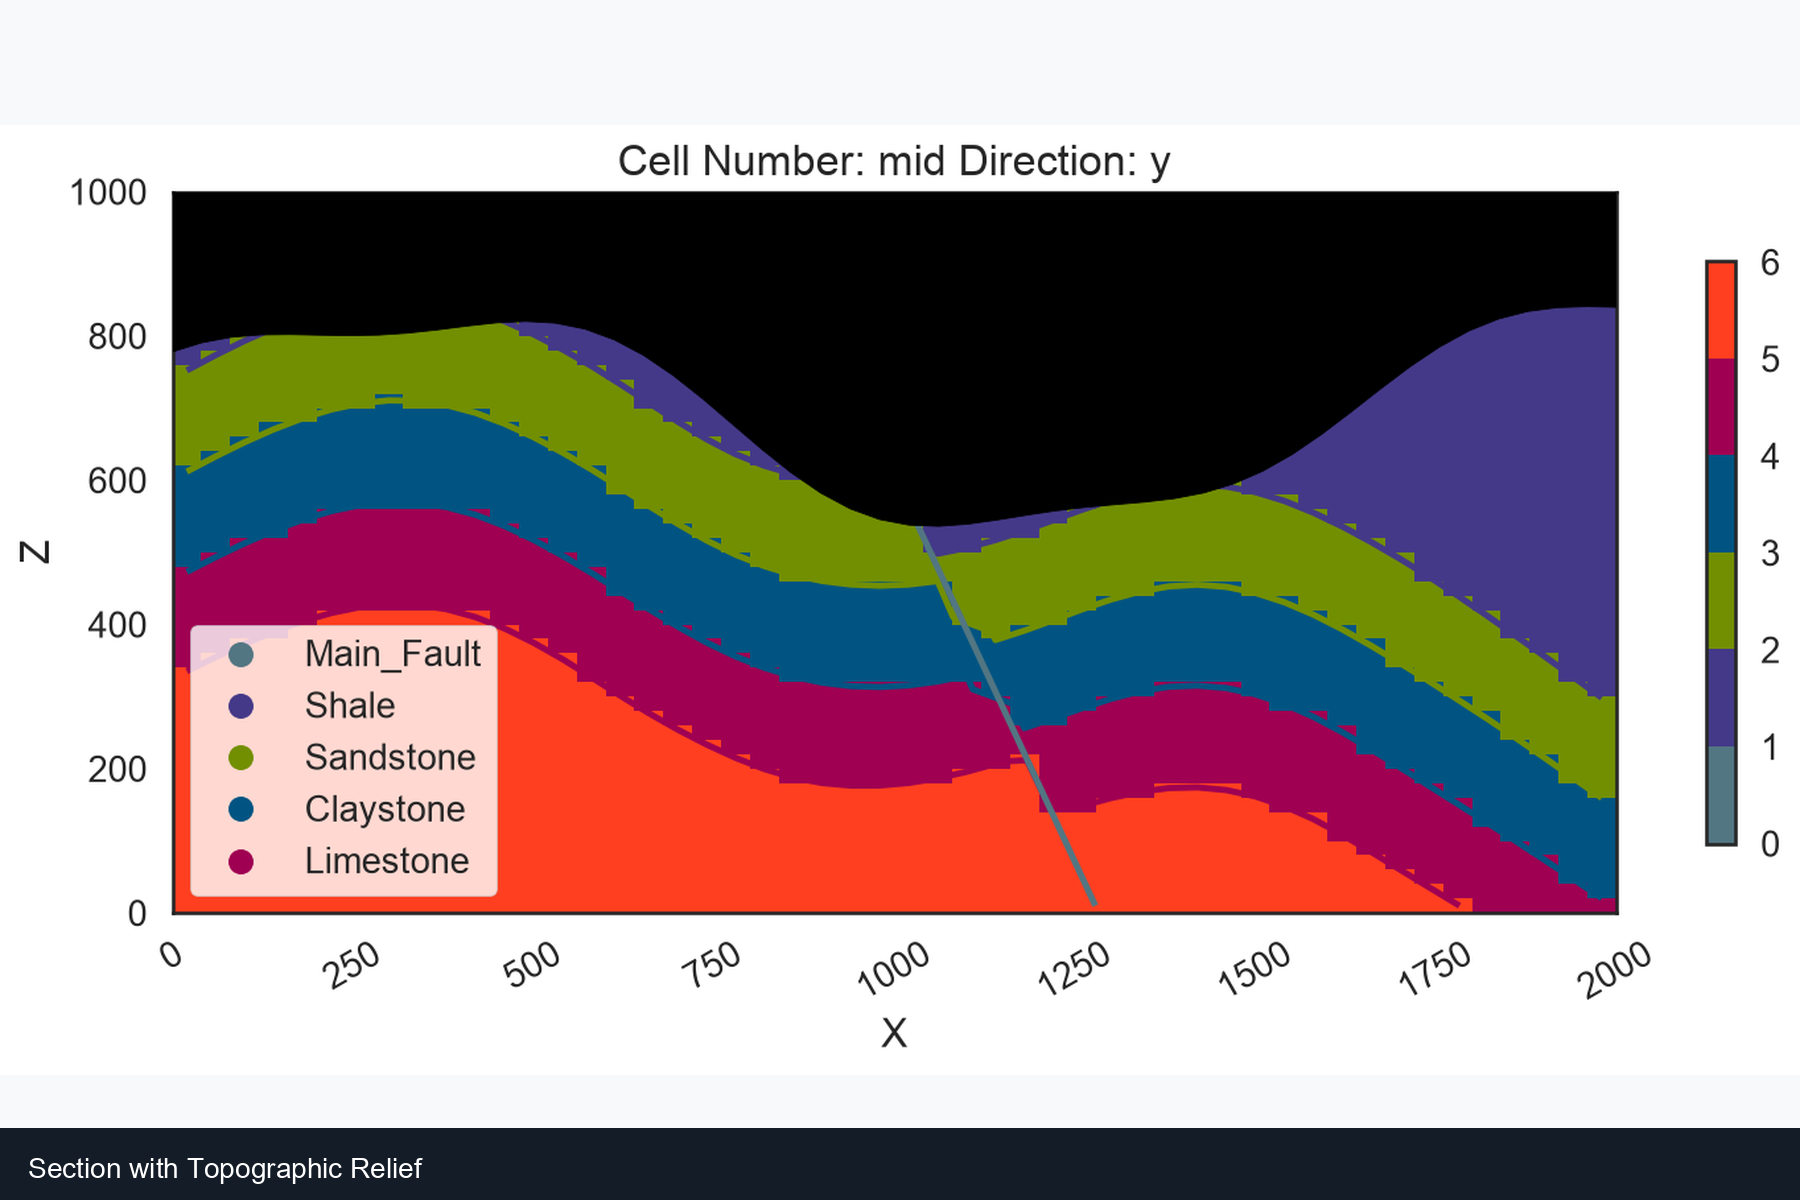
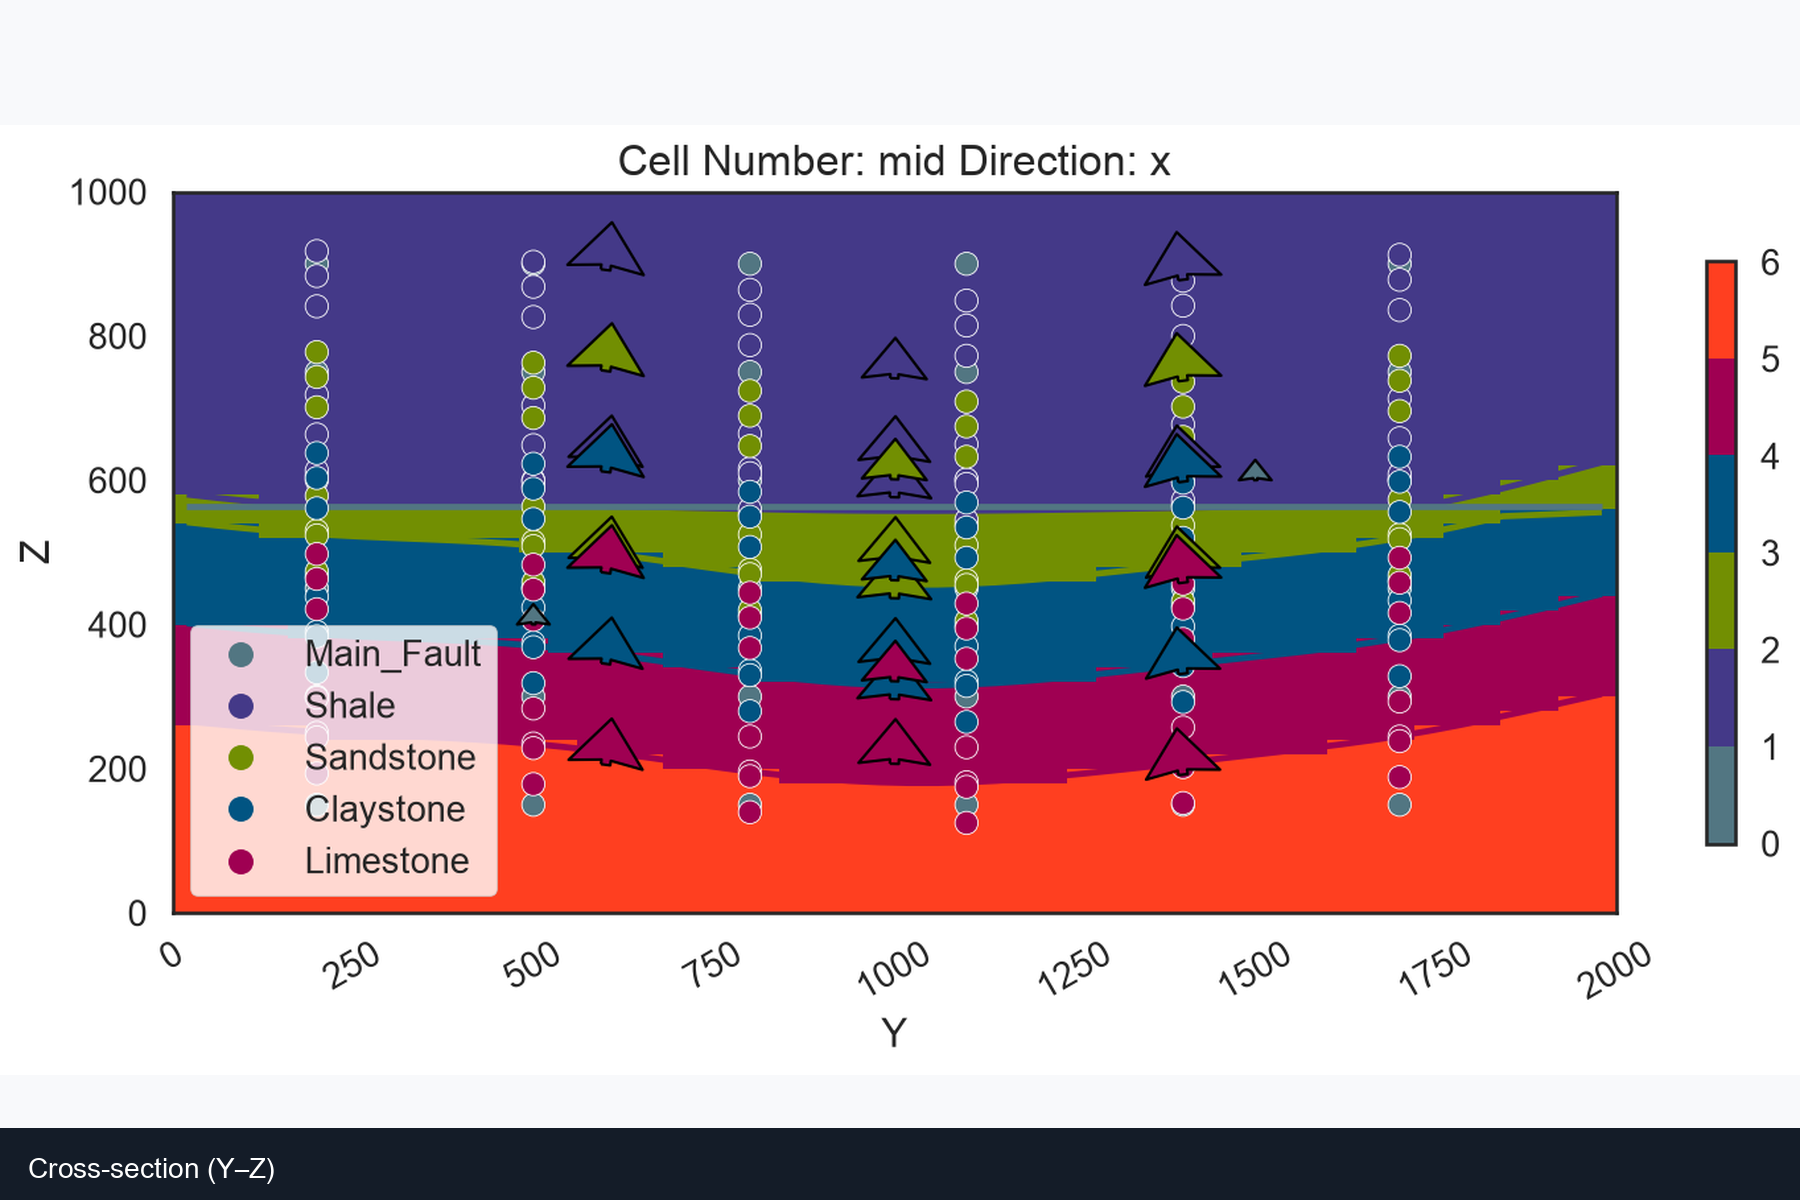
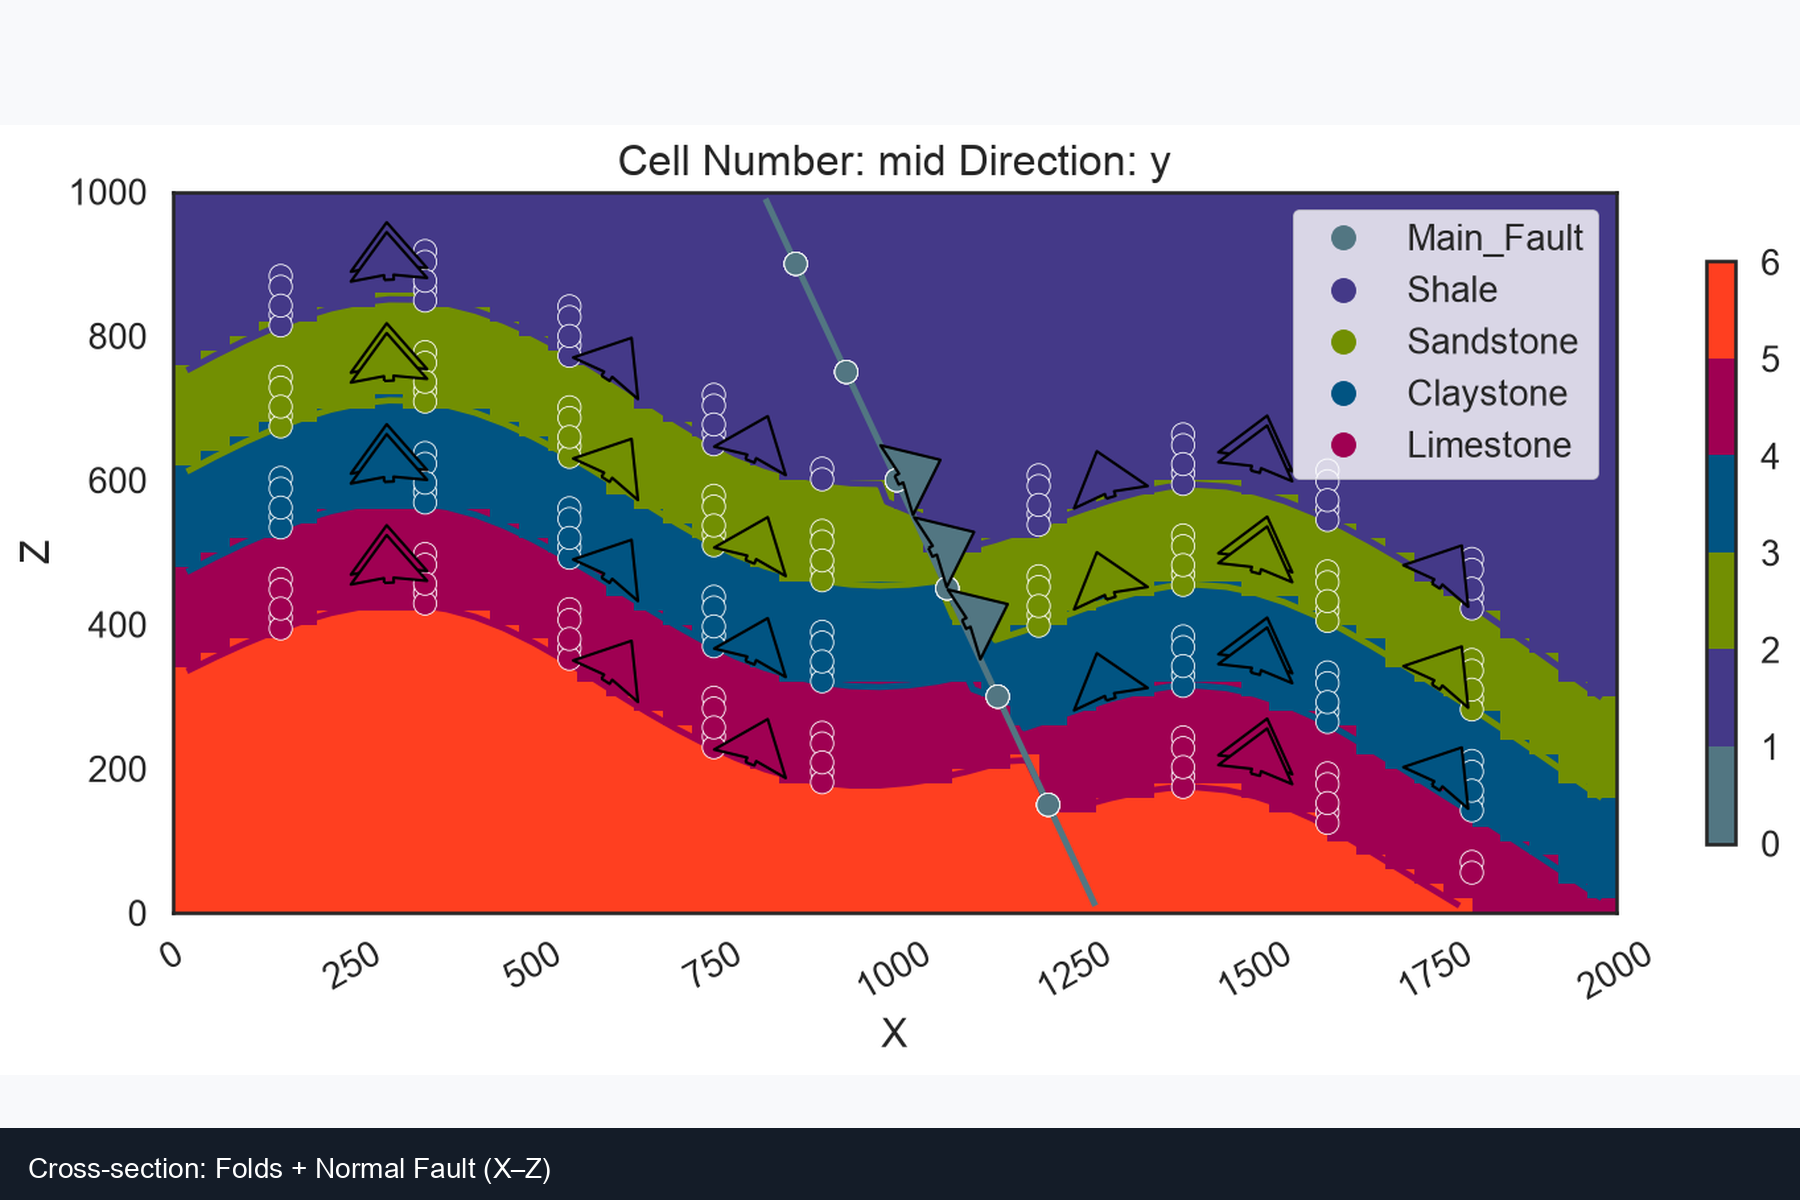
Synthetic data currently includes:
- Folded stratigraphy (sinusoidal undulation + regional dip)
- A normal fault (
Main_Fault, east-dipping, hanging wall down) - Topographic relief (hills + a fault-valley style depression)
Example fold geometry used for synthetic interfaces:
$$ Z(x,y) = Z_0 - \tan(\alpha)\,(x-x_0)
- A\cos!\left(\frac{2\pi(x-x_\phi)}{\lambda}\right)
- B\cos!\left(\frac{2\pi(y-y_\phi)}{\lambda_y}\right) $$
Local dips for orientations are derived from $\partial Z/\partial x$ and $\partial Z/\partial y$, so limbs are not a single global dip.
Important honesty note: the current 3D demo uses synthetic GemPy inputs generated by code, not yet fully automatic extraction from a real map. That was a deliberate choice: lock the modeling interface first, then plug real extractors into the same CSV schema.
How We Built It
| Layer | Stack |
|---|---|
| Map prototype | Python, OpenCV, scikit-learn, Gradio |
| Modeling | GemPy 2026 + gempy_viewer |
| Interactive 3D | PyVista (export_html via trame)—visualization only; GemPy builds the geology |
| Research | Literature survey (~100 papers): DIGMAPPER, map2loop, interactive boundary extraction, MapSAM/samgeo, SE-UNet, etc. |
Architecture principle we adopted from the literature:
Modular, human-in-the-loop pipelines beat “one magic model.” Color clustering is a local tool, not the whole system.
Recommended future extraction path (from our stage-1 review):
- Color maps: legend-driven priors + superpixels + interactive correction + topology repair
- B&W maps: line enhancement → skeletonization → vector tracing (no color clustering)
What We Learned
- 3D geology needs more than outlines. GemPy needs locations (surface points), gradients (orientations), and stack order/topology—exactly the map2loop-style view of position / gradient / topology.
- Unsupervised color clustering is brittle. Same unit can vary in color; different units can look similar; lines and labels pollute pixel statistics; B&W maps break the method entirely.
- Backend-first is a valid strategy. Fabricating well-posed CSV data let us prove folds, faults, topography, and interactive HTML export before perfecting CV.
- Visualization ≠ modeling. PyVista makes the model rotatable; GemPy’s potential-field interpolation creates the geology.
- Open science tools are enough for a serious prototype: GemPy + PyVista + a clear CSV contract is a full teaching and research path without commercial licenses.
Challenges
| Challenge | What happened | How we responded |
|---|---|---|
| Map extraction quality | KMeans/MeanShift failed on noisy/B&W maps | Literature-backed dual pipeline; deprioritize pure clustering |
| Blocking on the hardest step | Front-end CV stalled the whole project | Synthetic data → GemPy MVP first |
| API / dependency friction | GemPy 2026 APIs, separate venvs, HTML export needing trame/nest_asyncio2 |
Isolated .venv-gempy, documented install path |
| “Is a PNG a 3D model?” | Static screenshots are not interactive | Export model_3d.html for real rotate/zoom |
| Geological richness | Flat layers looked toy-like | Added folds, a normal fault, and DEM-style topography |
Impact & Next Steps
Today: an open pipeline from structured constraints to an interactive 3D geological model, plus a honest map-extraction prototype and a clear research roadmap.
Next:
- Replace synthetic points with legend-driven / line-based extraction aligned to the same CSV schema
- Georeferencing and real DEM $Z$
- Attitude-symbol and fault-trace modules
- Tighter GemGIS/map2loop-style exports for teaching and field courses
Closing
We set out to make 3D geology less exclusive. We have not fully automated “photo of a map → perfect model,” and we are transparent about that. What we have built is a working modeling spine, a realistic diagnosis of map AI, and a path that students can actually run—from equations and CSVs to a browser you can spin with a mouse.
That, for us, is the point of the project: not a black-box demo, but a reproducible bridge between planar maps and 3D earth models.
Project: Intelligent 3D Geological Modeling from Planar Maps (geo3d_project)
Core tools: OpenCV · Gradio · GemPy · PyVista


Log in or sign up for Devpost to join the conversation.