-
-

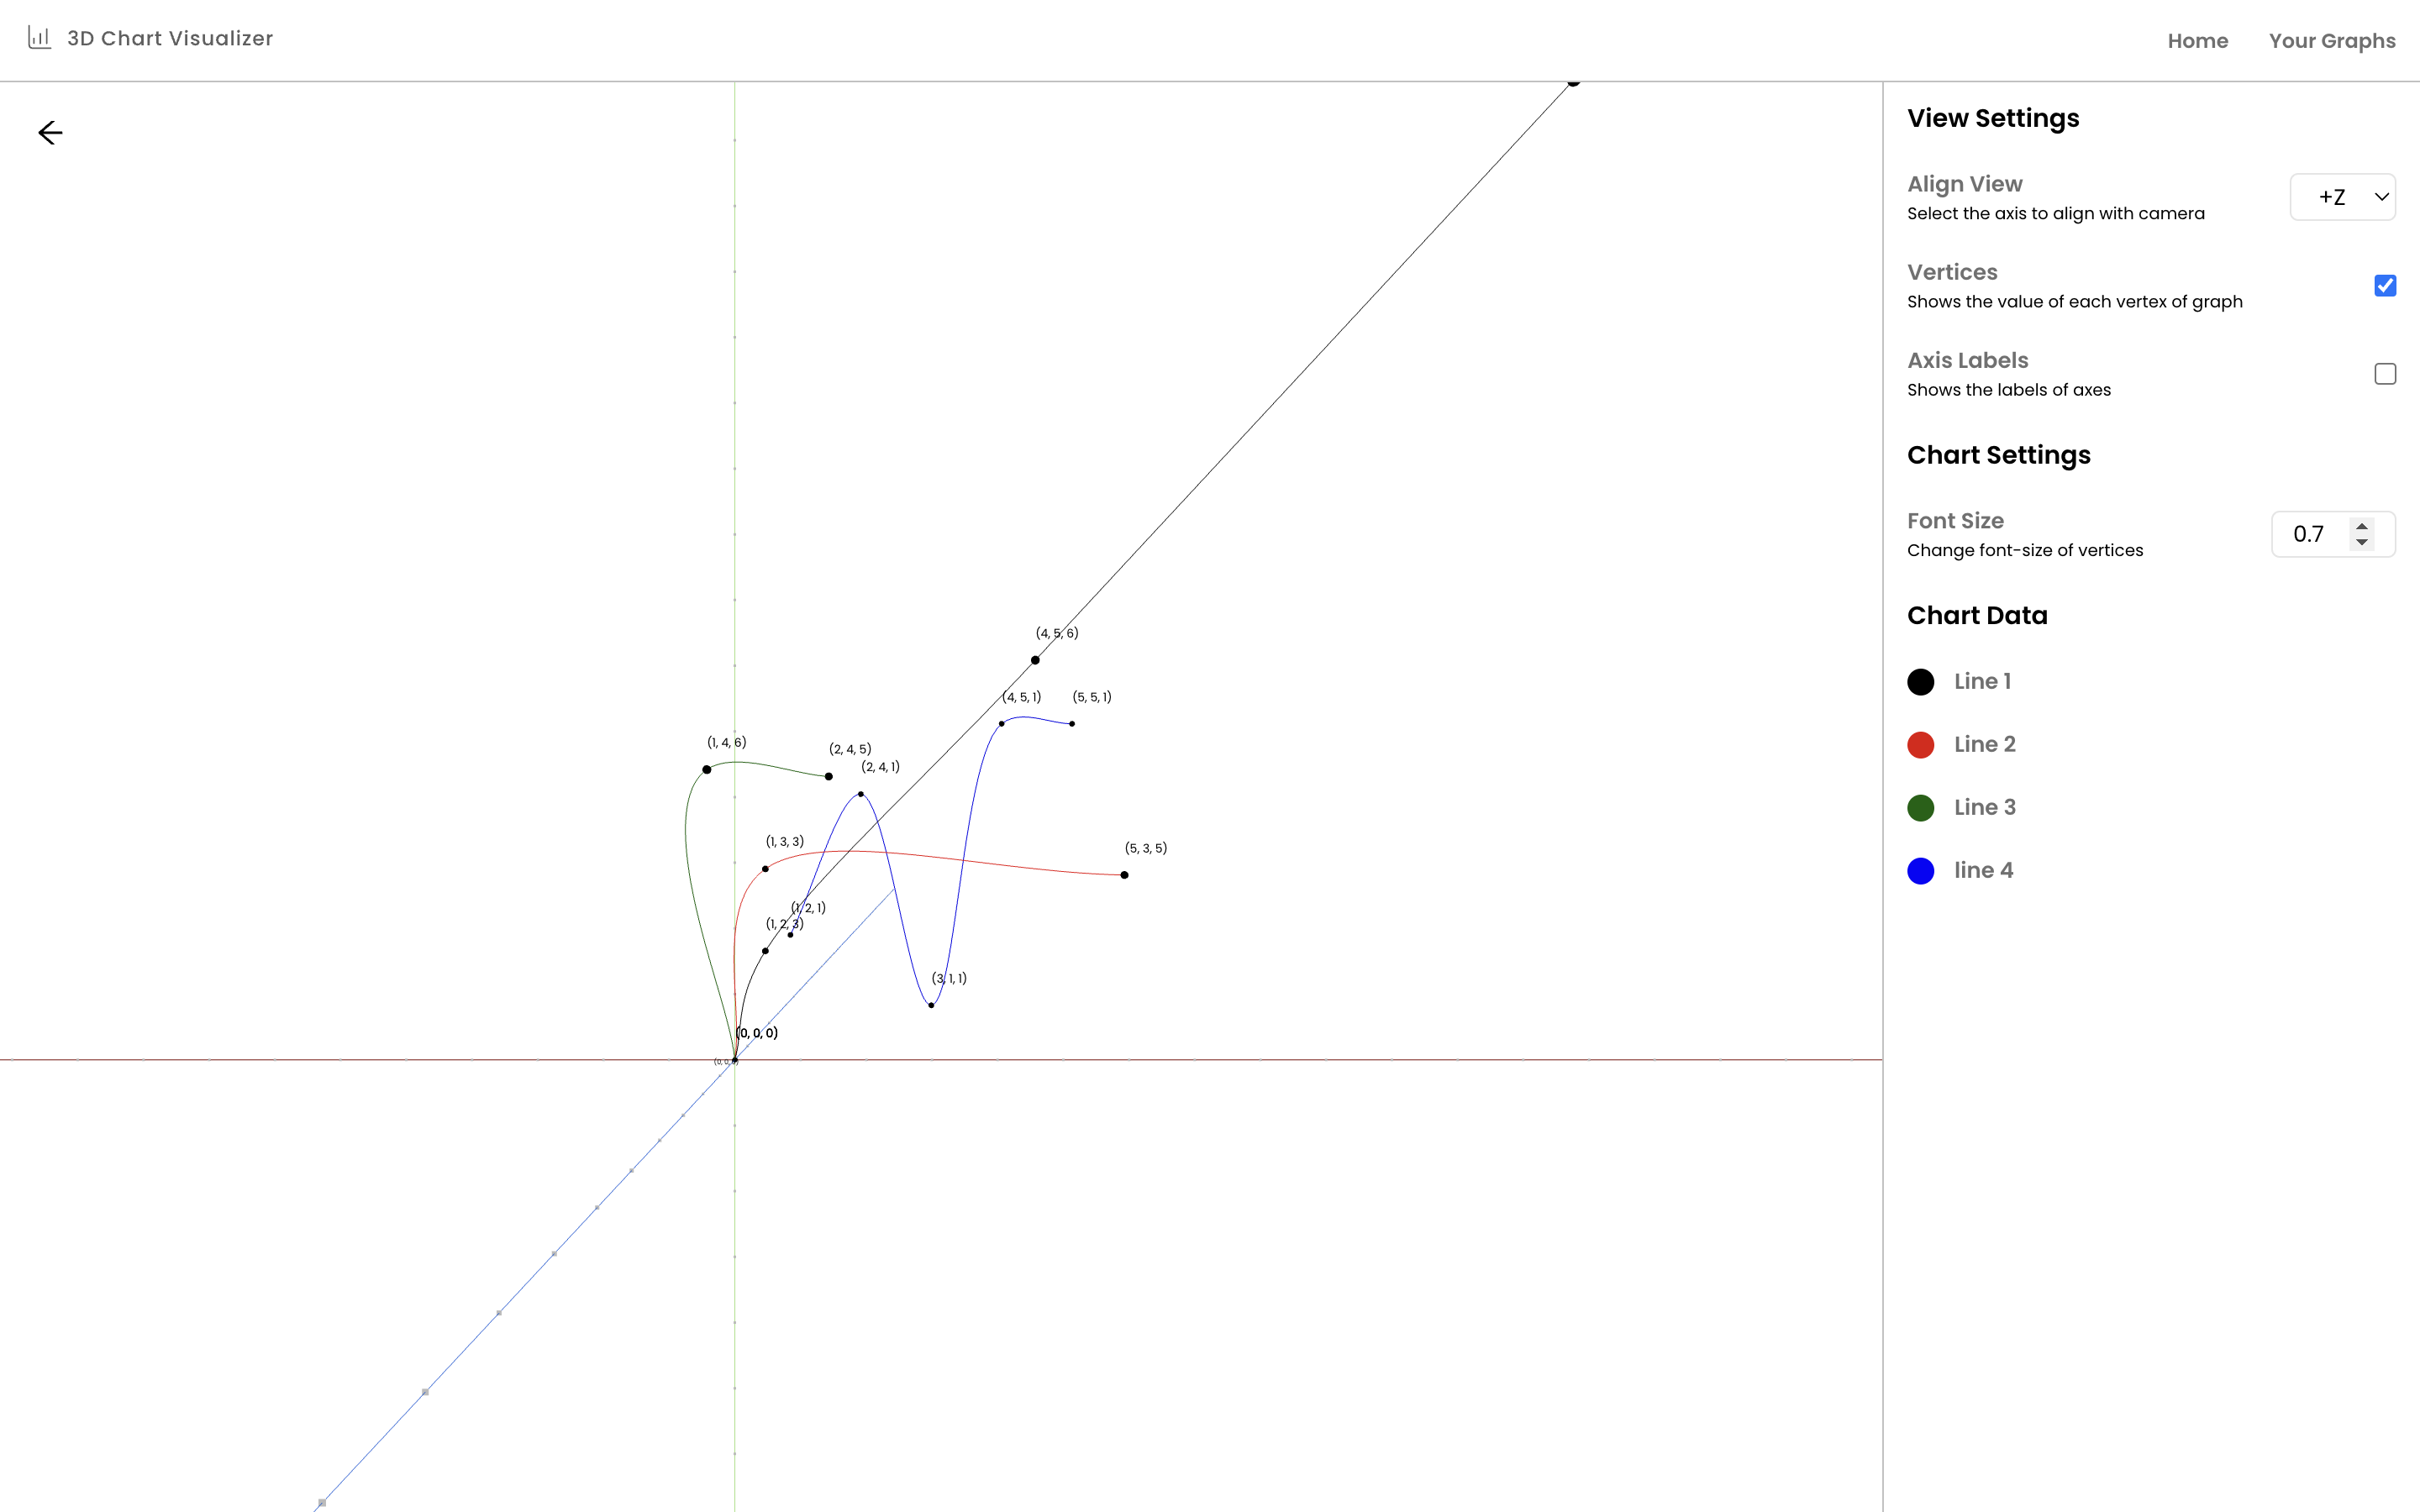
Thumbnail
Inspiration
When I was in high school, we used to learn about 3D lines and I saw that learning about 3D lines is hard for 90% of students as we used to be taught on a chalkboard and were asked to imagine the third dimension. That inspired me to create this app that can help users easily work with lines and other charts with a third dimension.
What it does
This app can be used to create 3D Line and Pie plots currently. This lets users explore data from different angles and viewpoints, providing an immersive and interactive experience. We can create 3D charts, visualize them, and customize them.
How we built it
The 3D Charts is both client and server side. The client-side app is made with JavaScript using the React library and it uses THREE.js for creating 3D scenes for charts and the server-side app is made with Express.js library using MongoDB as a database.
Challenges we ran into
Creating charts was definitely a challenge, especially the pie plot. The Cylinder Geometry is provided by three.js if the cut is not closed from the sides, so we have to make another component that can create a part of the cylinder that is closed from all sides. Other than that, I love working with challenges, and in the future, we can add more kinds of charts in this app which is gonna be a challenge.
Accomplishments that we're proud of
We are proud of learning and exploring more about three.js which was very fun to do.
What we learned
We learned about many new functions and classes from three.js and the process itself helps us to get better and learn more.
What's next for 3d Charts
Now, 3D Charts can be used to create line and pie plots, but in future, we can add many different types of plots like scatter, area, and bubble, etc. Also, we can add many different options to make this app more easier to use and useful.


Log in or sign up for Devpost to join the conversation.