-
-
3D NBA Shot Chart

Inspiration
I was always fascinated with shot charts and locations in NBA games. I wanted to try to recreate the 3D shot charts that are used by ESPN in their broadcasts. I initially started with working with 2D shot charts but eventually began researching ways to create 3D shot charts, leading me to create this app.
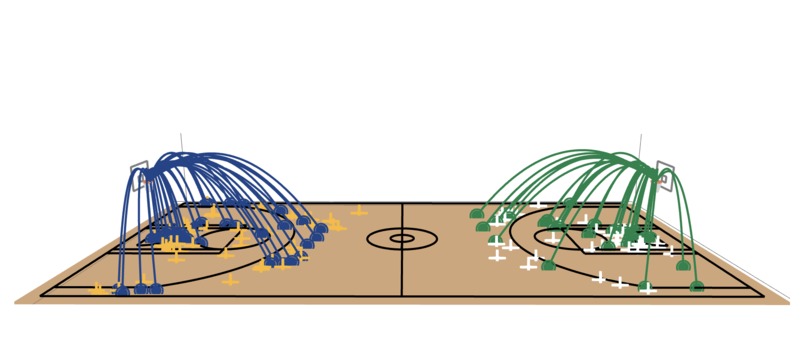
What it does
The 3D Basketball Shot Visualizer displays shots from college basketball, the NBA, and WNBA games in an interactive 3D court. Users can explore shot charts that illustrate shot locations, paths, and outcomes, providing a comprehensive view of different games.
How we built it
I built the app using Streamlit for the front-end interface and used the sportsdataverse API to acquire the shot location data for the shot charts. I utilized libraries like Matplotlib and Plotly for 3D visualizations, ensuring a smooth and engaging user experience.
Challenges we ran into
One of the main challenges was ensuring the accuracy of the shot locations, particularly with translating 2D shot data onto a 3D court. I also initially struggled with matching video highlights with selected shots. Additionally, optimizing the app for performance with large datasets caused some challenges.
Accomplishments that we're proud of
I'm proud of creating a user-friendly interface that allows users to easily navigate and interact with the 3D visualizations. The positive feedback from users has been encouraging, highlighting the app’s potential in basketball analysis.
What we learned
I learned a lot about data visualization techniques and how to effectively communicate complex data in an accessible way. I also learned a lot about different Python libraries for data visualization and how to effectively use them.
What's next for 3D Basketball Shot Visualizer
Moving forward, I hope to expand the data to include international leagues and integrate more advanced statistical analyses into the app.

Log in or sign up for Devpost to join the conversation.