-
-

The Website
-
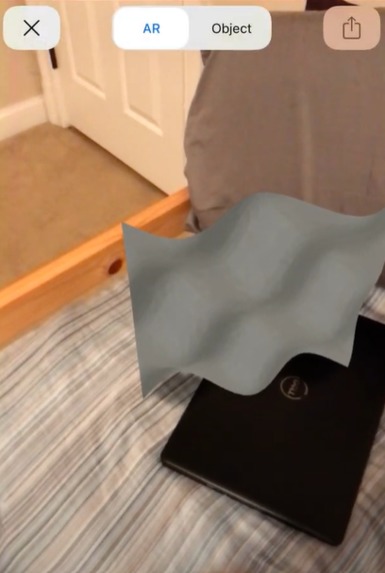
AR 3D Model example 1
-
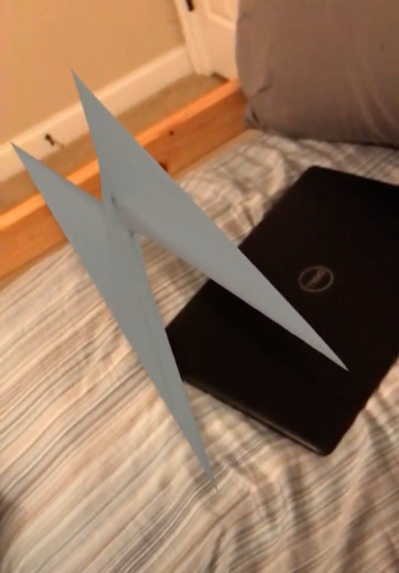
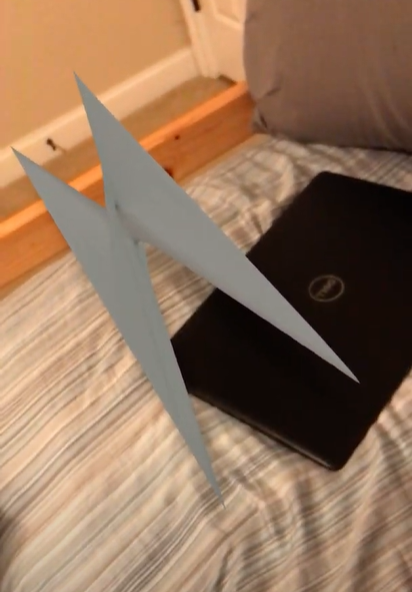
AR 3D Model example 2


Inspiration
We wanted to combine the powers of wolfram and echoar and make a useful program for students, so we thought of 3d graphing in AR.
What it does
You input a 3d equation and the graph window size, and the website will take you to an AR 3d model of the graph.
How I built it
We used HTML, javascript, and flask for the websites. We used the wolfram client library for python, echo ar, and flask for receiving website data, creating a 3d model from it, and displaying the result as an AR 3d object.
Challenges I ran into
We had trouble converting website data into a format the wolfram client library could understand, and with uploading and directing the user to the AR 3d model. However, we did find solutions to all these challenges.
Accomplishments that I'm proud of
We made the integration between wolfram client library and echo ar run smoothly, and we made the websites available to any device on the network through flask.
What I learned
We the ins and outs of the wolfram and echo ar APIs, and how to create web servers with flask.
What's next for 3D AR Grapher
We would improve the UI to look more appealing, and we would offer users more customization for their graphs.


Log in or sign up for Devpost to join the conversation.