-
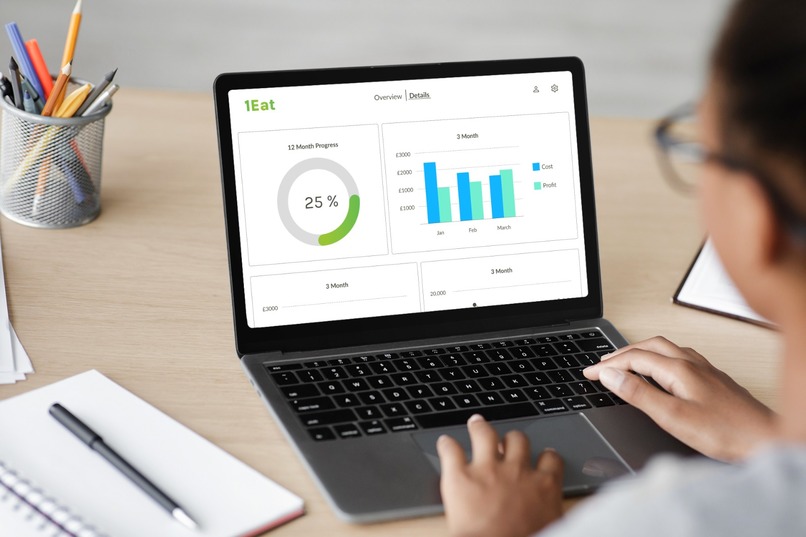
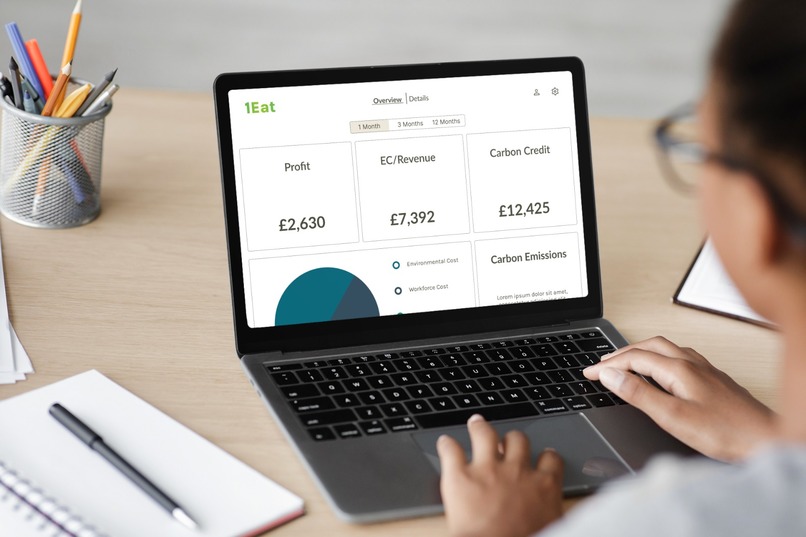
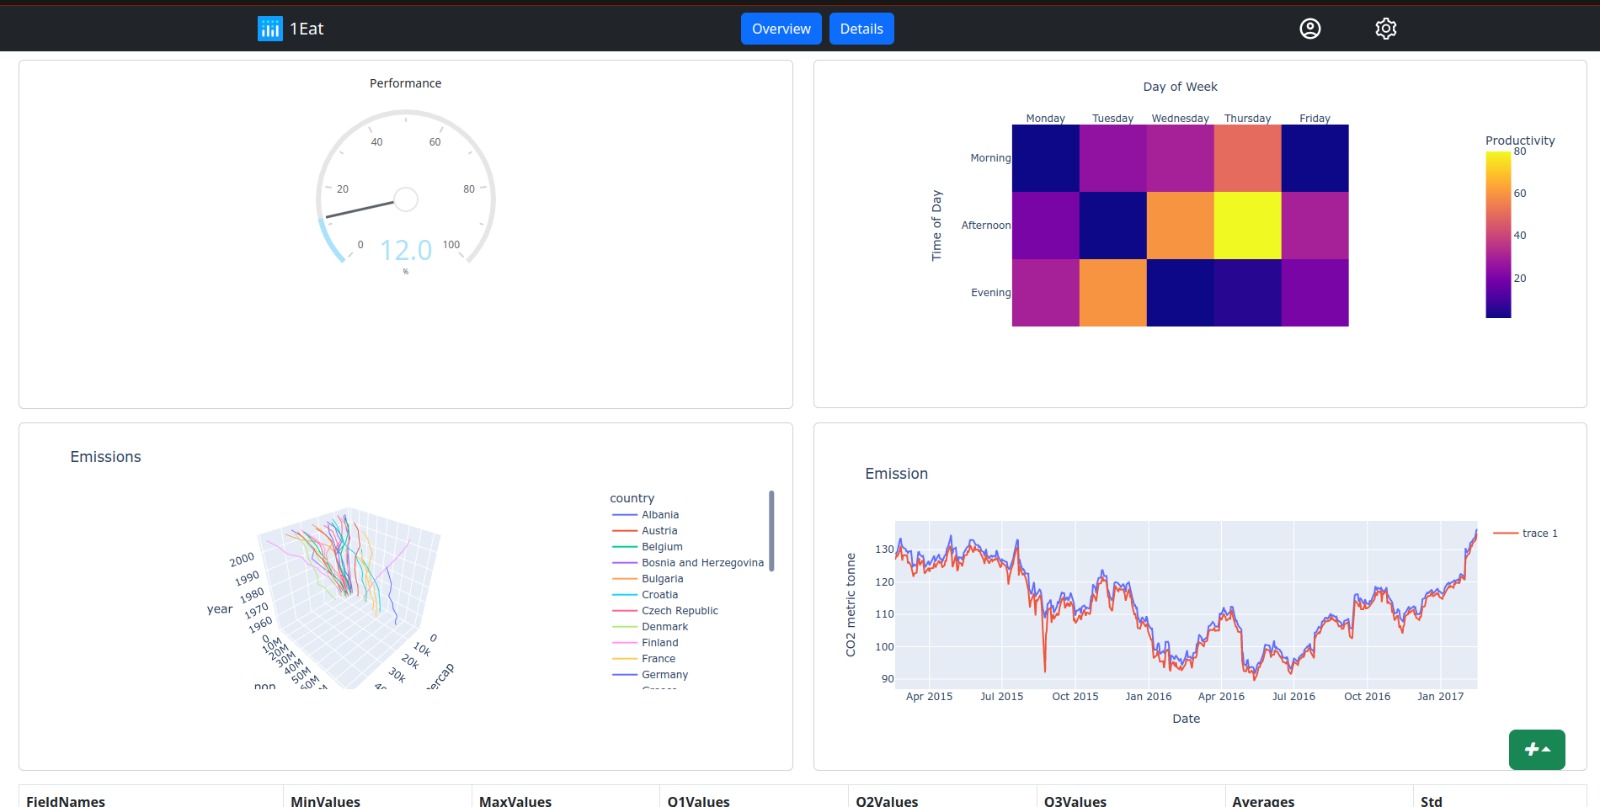
Simplified overview design for use by managers and those not wanting to be overwhelmed with data.
-
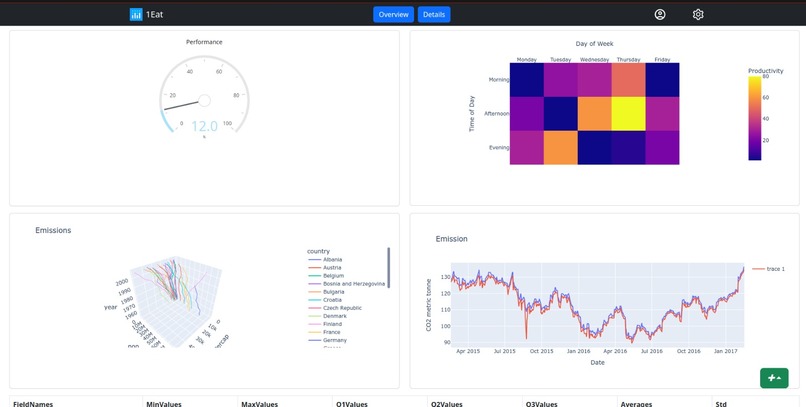
Designed view for the detailed data analysis with graphs and bold and colourful details.
-
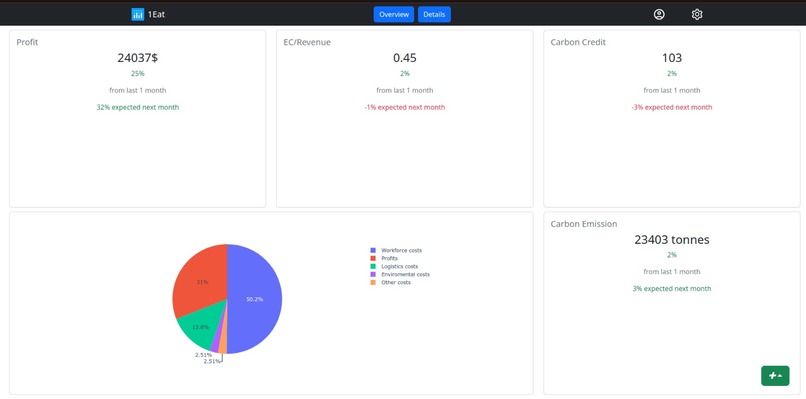
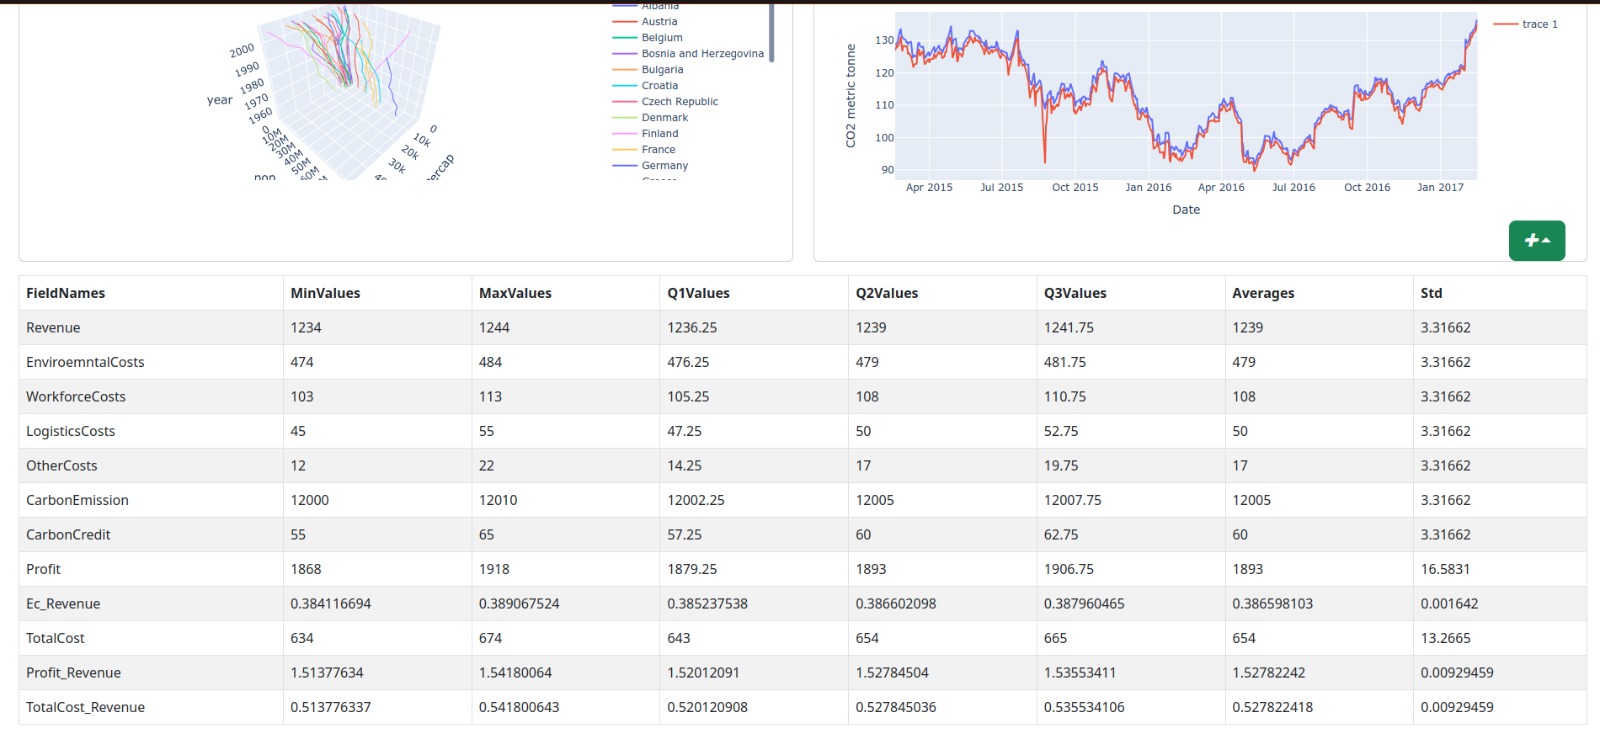
Detailed overview of data for use by analytical teams.
-

Tableised data from MATLAB. Continuous data from the details page.
-
Simplified page using data from MATLAB to show the company's carbon emission data and monthly revenue.


Inspiration
Many worldwide companies contribute to global warming and the ever increasing amount of carbon emissions. Our tool is designed to help companies reduce their carbon footprint as well reduce their carbon tax each year.
What it does
We provide a web app dashboard to allow companies to view their historical carbon data against their revenue and profit. They can then clearly see what they must do to avoid increasing their carbon credit budget with the help with MATLAB analysis.
We use Auth0 for credential management to allow both company managers and analysis teams to log in effortlessly.
We also make use of Twilio to allow users to set up alerts when the tool predicts the company is using too much carbon.
MATLAB is used in the backend to analyse the large data sets the company provides.
How we built it
Use delved into new terrain with Python which acts as our web server. Python then interacts with many different areas, including public APIs and graphing libraries.
The web server is powered by the Flask framework which is wrapped with Dash, which provides an easy interface to show Plotly graphs and charts. These graphs are what the users see the most and we designed them to be as easy to read as possible while portraying the data they want to see.
Challenges we ran into
We never used Python for such a project, so we worked hard to read documentations, vet competing libraries and debug code. To be honest, it was more than we could handle, but we made a tool that can be used to help improve the environment by allowing companies to see what they are falling behind on.
Accomplishments that we're proud of
Our team was originally three software engineers. We welcomed in two more members during the event, one a physics major with an interest in coding and Hackathons, and another who is a UI/UX designer.
We were able to work with different people from non-coding backgrounds to produce a data accurate and beautiful interface design.
We had never used Python in a project like this, so we are very proud on actually creating a web app in the first place. The framework we used, Dash, is an enterprise library which likely requires training to be used in industry. We managed to work out a solution with such training and in such little time.
What we learned
We had learned to work together with different people. Our UI/UX designer took a massive load from the programmers where they could design an interface with their knowledge of how our users would use the web app, and the programmers would then program the design. This communication was new to us but was most welcome.
We learned brand new technology and services such as Auth0 and Twilio, delved deeper into MATLAB for data analysis, and further improved our Python language skills.
What's next for 1EAT
We'd like to test with real companies and their data and see how it could improve their annual profits and carbon footprint. We should also improve the code so that is maintainable by other developers.
At some other point, we should also move away from only using Python and using other managed languages with frameworks such as Electron in NodeJS to allow the web app to work a desktop environment and improve language accessibility.


Log in or sign up for Devpost to join the conversation.