-
-
One of our examples... curious? Have a look in our github repository!
-
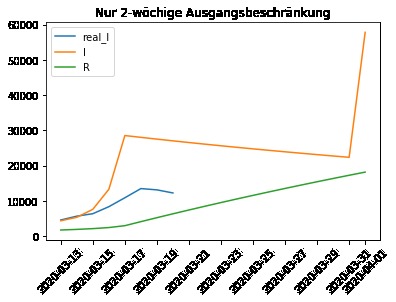
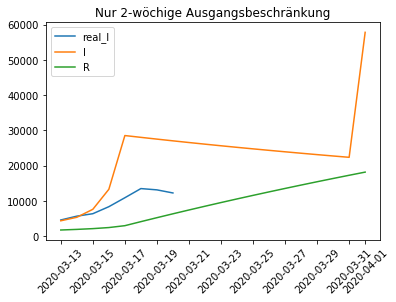
Simulation of infected cases with the effect of a 2-week curfew visible. If the curfew is stopped after two weeks, infection explodes again
-
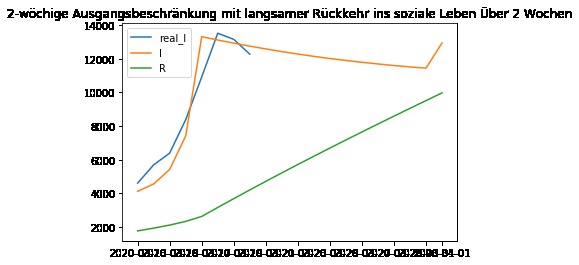
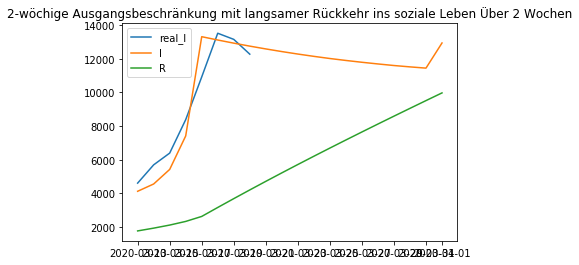
Simulation of infected cases with a 2-week curfew. Slowly ramping up social interactions has a desirable attenuating effect.
Inspiration
COVID-19 already caused a lot of deaths worldwide and especially in Europe the situation gets more severe every day. Italy struggels a lot with its hospital capacities. We don't want that to happen to Germany as well. We want to give the government and hospitals the opportunity to take the right actions and thus prevent deaths and fast spreading of the virus. Furthermore, it is our goal to show people, what can be achieved by follow the guidelines given by the government and how everyone can help to save lives!
What it does
This is why we had the idea to create a dashboard to show the current situation of infections and deaths caused by COVID-19 in a heatmap of Germany and furthermore include simulation options for e.g. degree of interaction or mobility and number of beds in intensive care units.
How we built it
We followed some ideas we found in the following two articles and adjusted it to the case of Germany: https://www.imperial.ac.uk/media/imperial-college/medicine/sph/ide/gida-fellowships/Imperial-College-COVID19-NPI-modelling-16-03-2020.pdf https://towardsdatascience.com/modelling-the-coronavirus-epidemic-spreading-in-a-city-with-python-babd14d82fa2
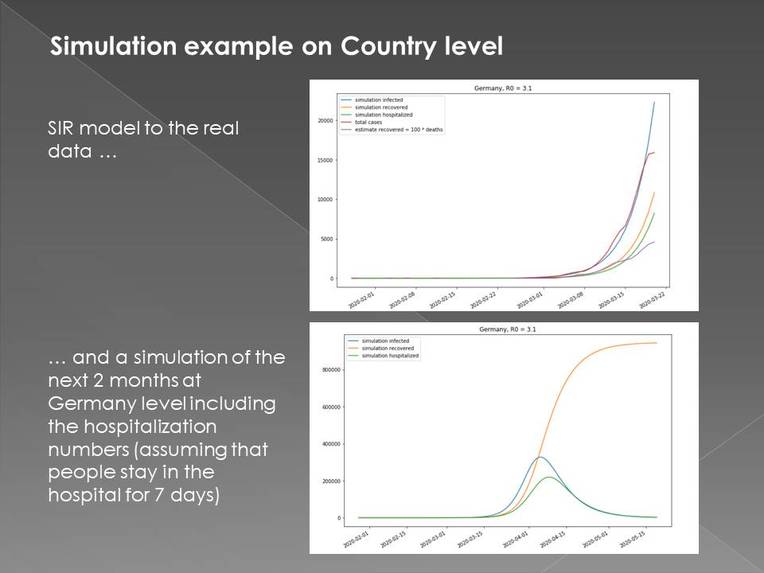
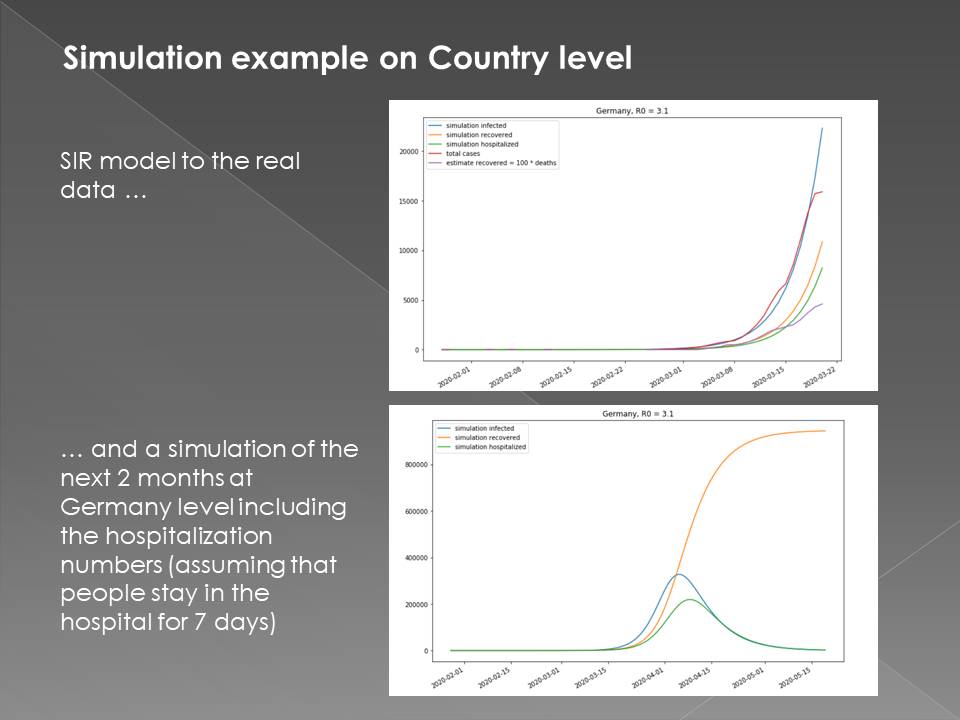
Therefore, we first gathered all publicly available data and assumptions we could find online. Then we wrote a python script to model the SIR model and simulations on it described in the second article for Germany. In the end we visualized our results with a heatmap for Germany.
Challenges we ran into
The main challenge was to find publicly available data on a detailed level and with a proper data quality. This is why we also had to use aggregated distribution assumptions for not available data.
Accomplishments that we're proud of
Although the hackathon was online and everybody was sitting alone on his or her laptop at home, we had a lot of fun, stayed motivated all the time, managed to split up tasks and align regularly without any problems or misunderstandings. We gathered and prepared a lot of data, build a model in a domain none of us is familiar with and visualized it in a very nice dashboard and all of this just in less than 48 hours!
What we learned
We learned new facts about COVID-19, new modelling approaches like the SIR model and especially getting to know new people and work together with them without having met them in person and work completely remotely.
What's next for 0038_daten_UnicornsVsVirus
We would like to enrich our model with more reliable and detailed data to create an even more powerful tool to help our government and hospitals! Hence a next step would be to get in contact with suitable data providers, building a professional dashboard with all possible simulation scenarios and challenge our model!


Log in or sign up for Devpost to join the conversation.