-
-

Das Team
-
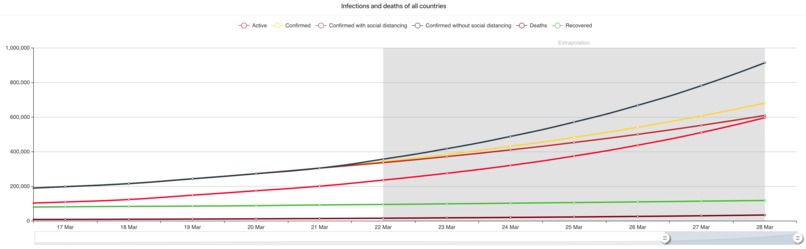
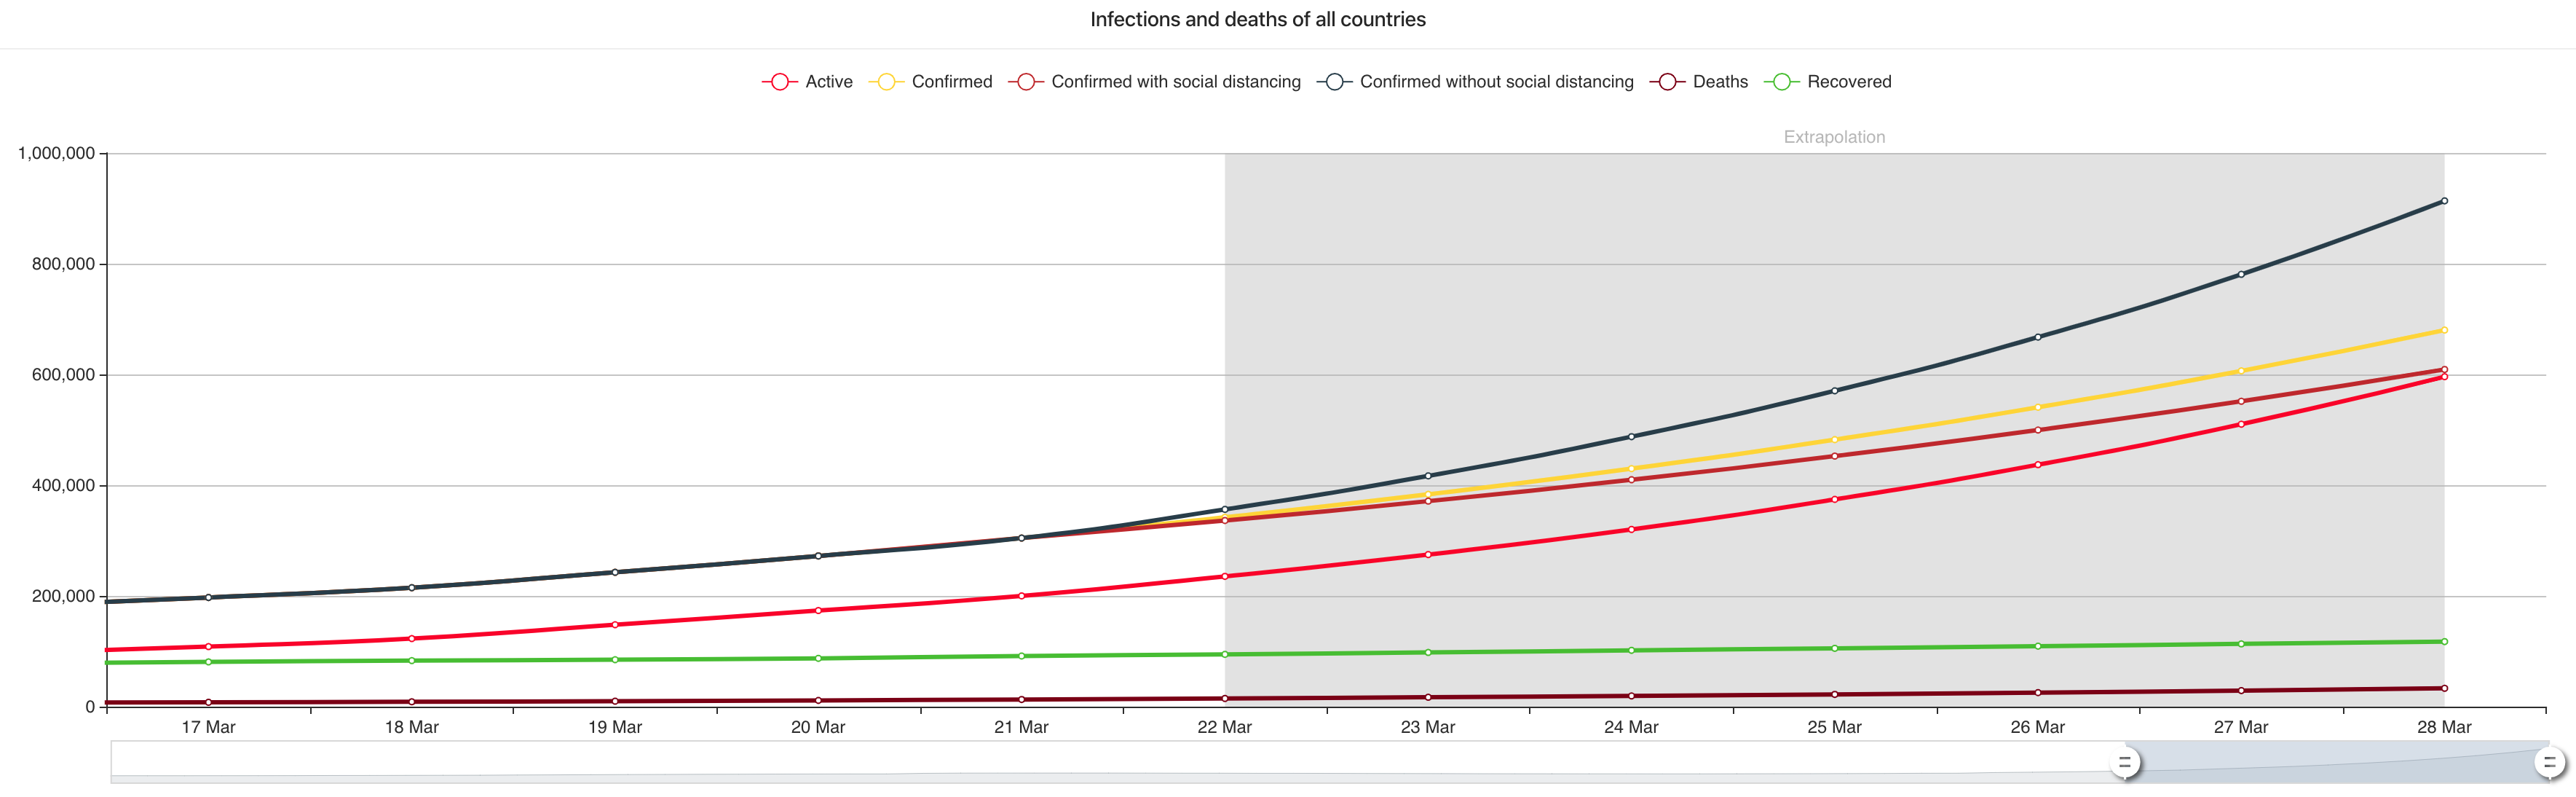
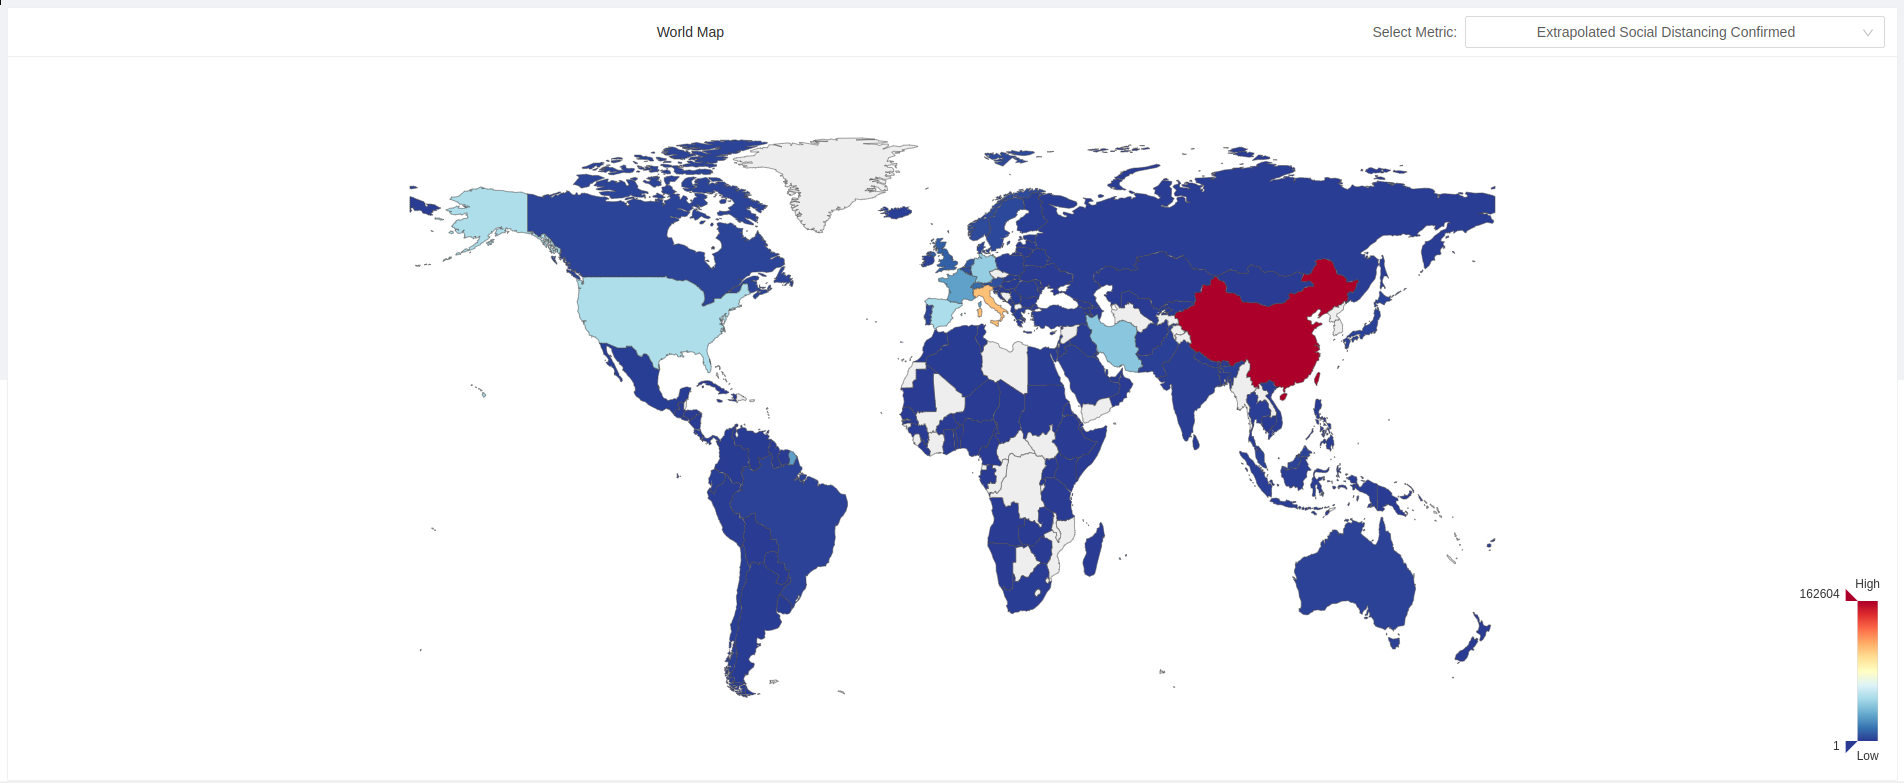
Extrapolation
-
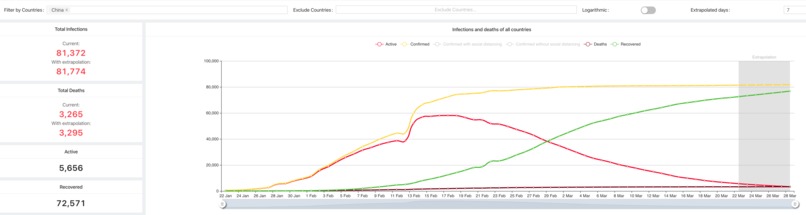
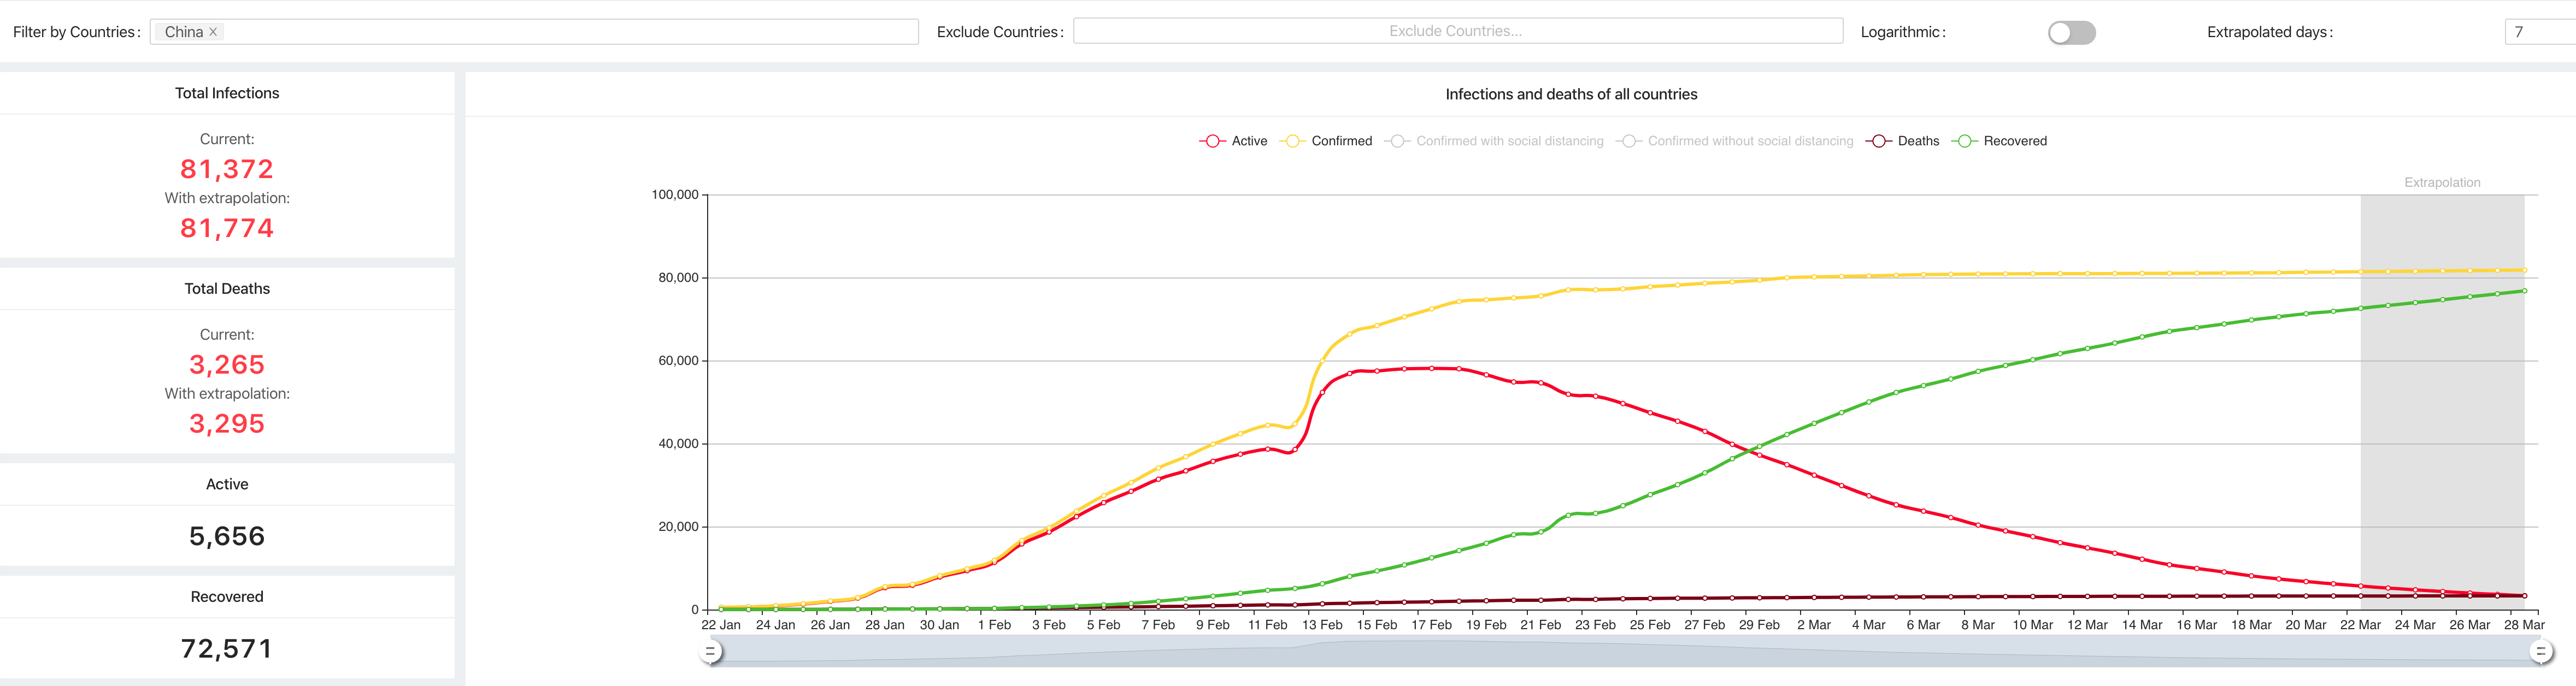
Beispiel China
-


Inspiration
An article that explains the importance of social distancing and states the problem of the dark figures of infected people. https://medium.com/@tomaspueyo/coronavirus-act-today-or-people-will-die-f4d3d9cd99ca
What it does
Our project provides a forecast of the Covid-19-spread depending on a naive forecast (with the moving average of the three last known gradients) of confirmed infections compared to the two different human behavior scenarios of social distancing and no social distancing.
The forecast is illustrated within a dynamic dashboard. The dashboard can show the past and future extrapolated data (i.e. active infections, confirmed infections, extrapolated confirmed infections with social distancing, extrapolated confirmed infections without social distancing, recovered and deaths) for one or more collected country worldwide.
How we built it
python, flask, pandas, react, echarts, google meets.
Challenges we ran into
The correct extrapolation of the daily increase of newly infected people for different social distancing strategies, as these extrapolations are only given on a weekly basis. Further challenges were the time restriction and problems at the deployment stage.
Accomplishments that we're proud of
The illustration of the effects of social distancing, so that everyone can understand and see them.
What we learned
That in times of the coronavirus staying at home slows the spread of Covid-19 and therefore saves lives!
What's next for 0038_Daten_Extrapolation
The possibility to select different social distancing strategies (e.g no contact, 50% contact reduction, ... )


Log in or sign up for Devpost to join the conversation.