-

Jumbotron for the main/home pages
-
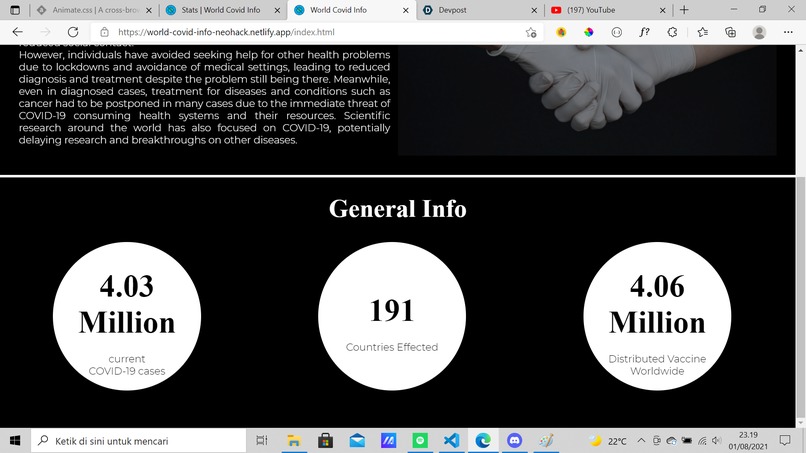
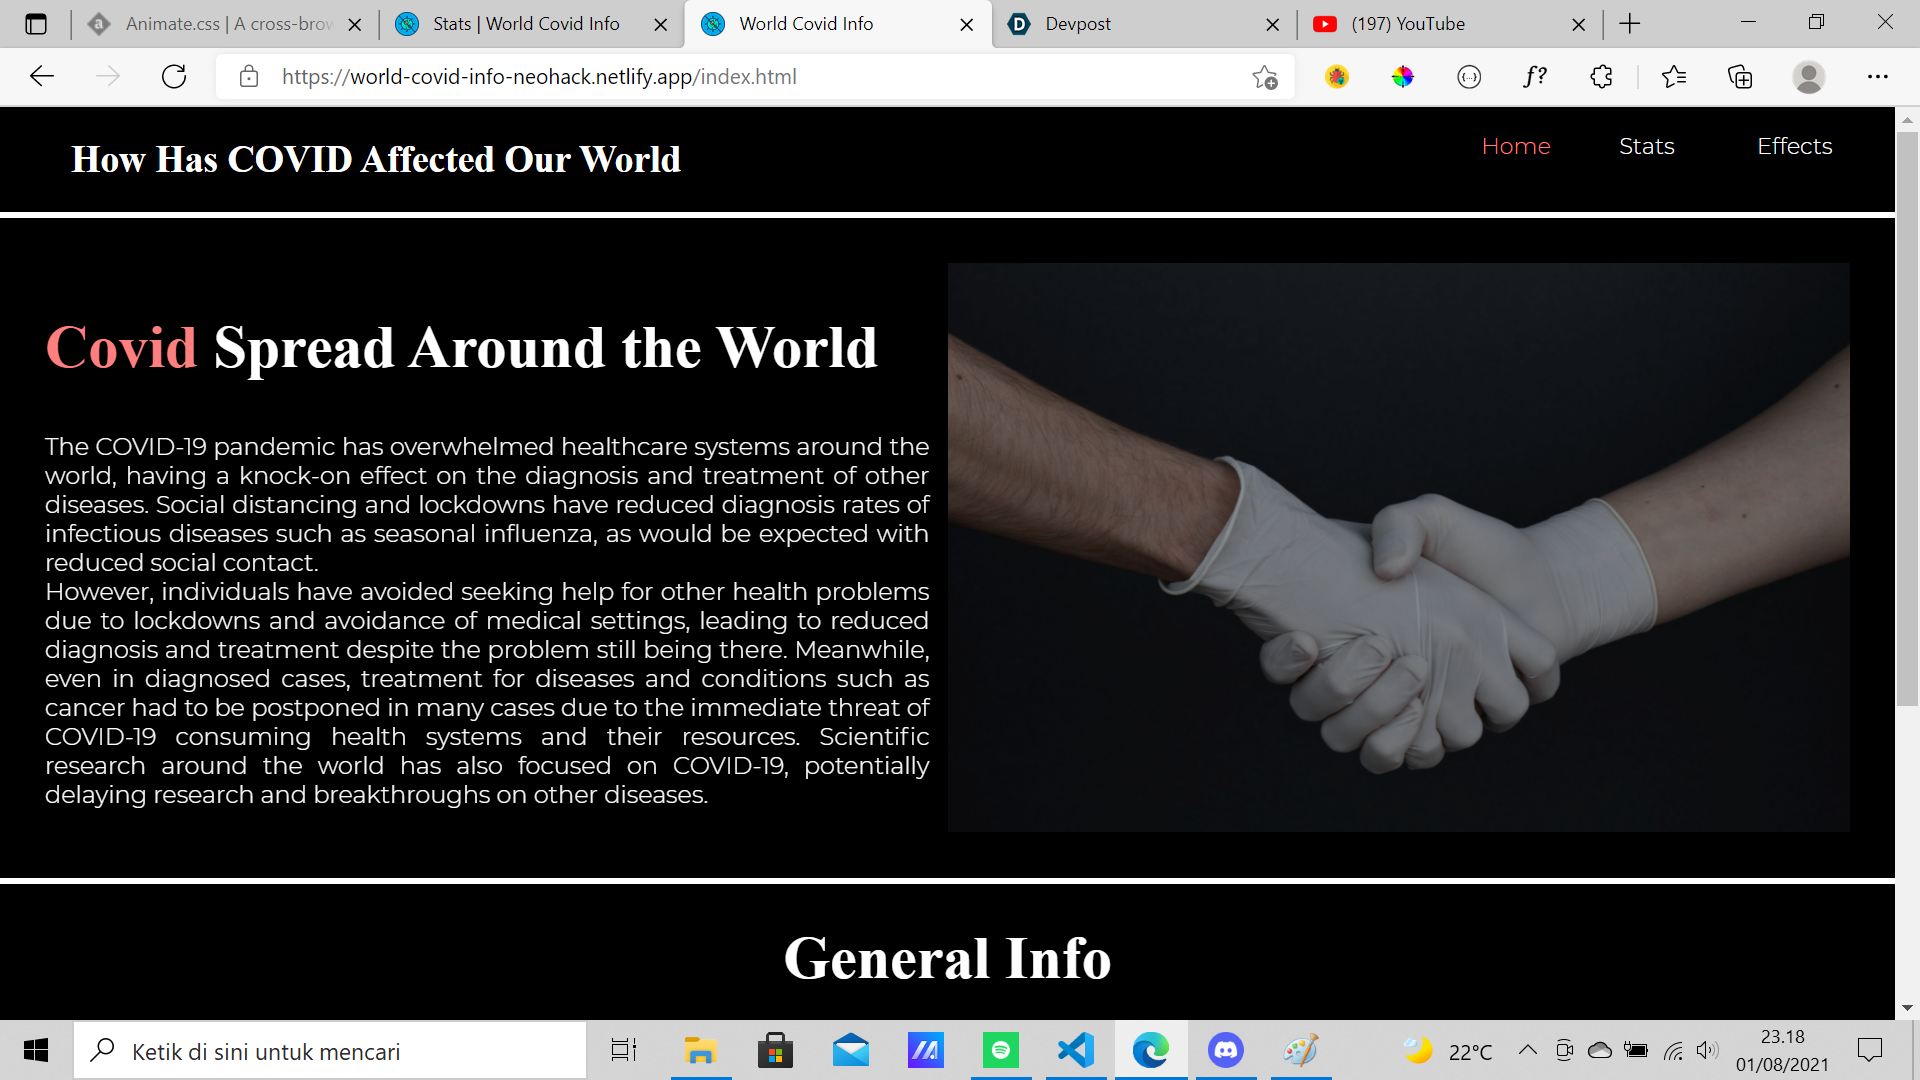
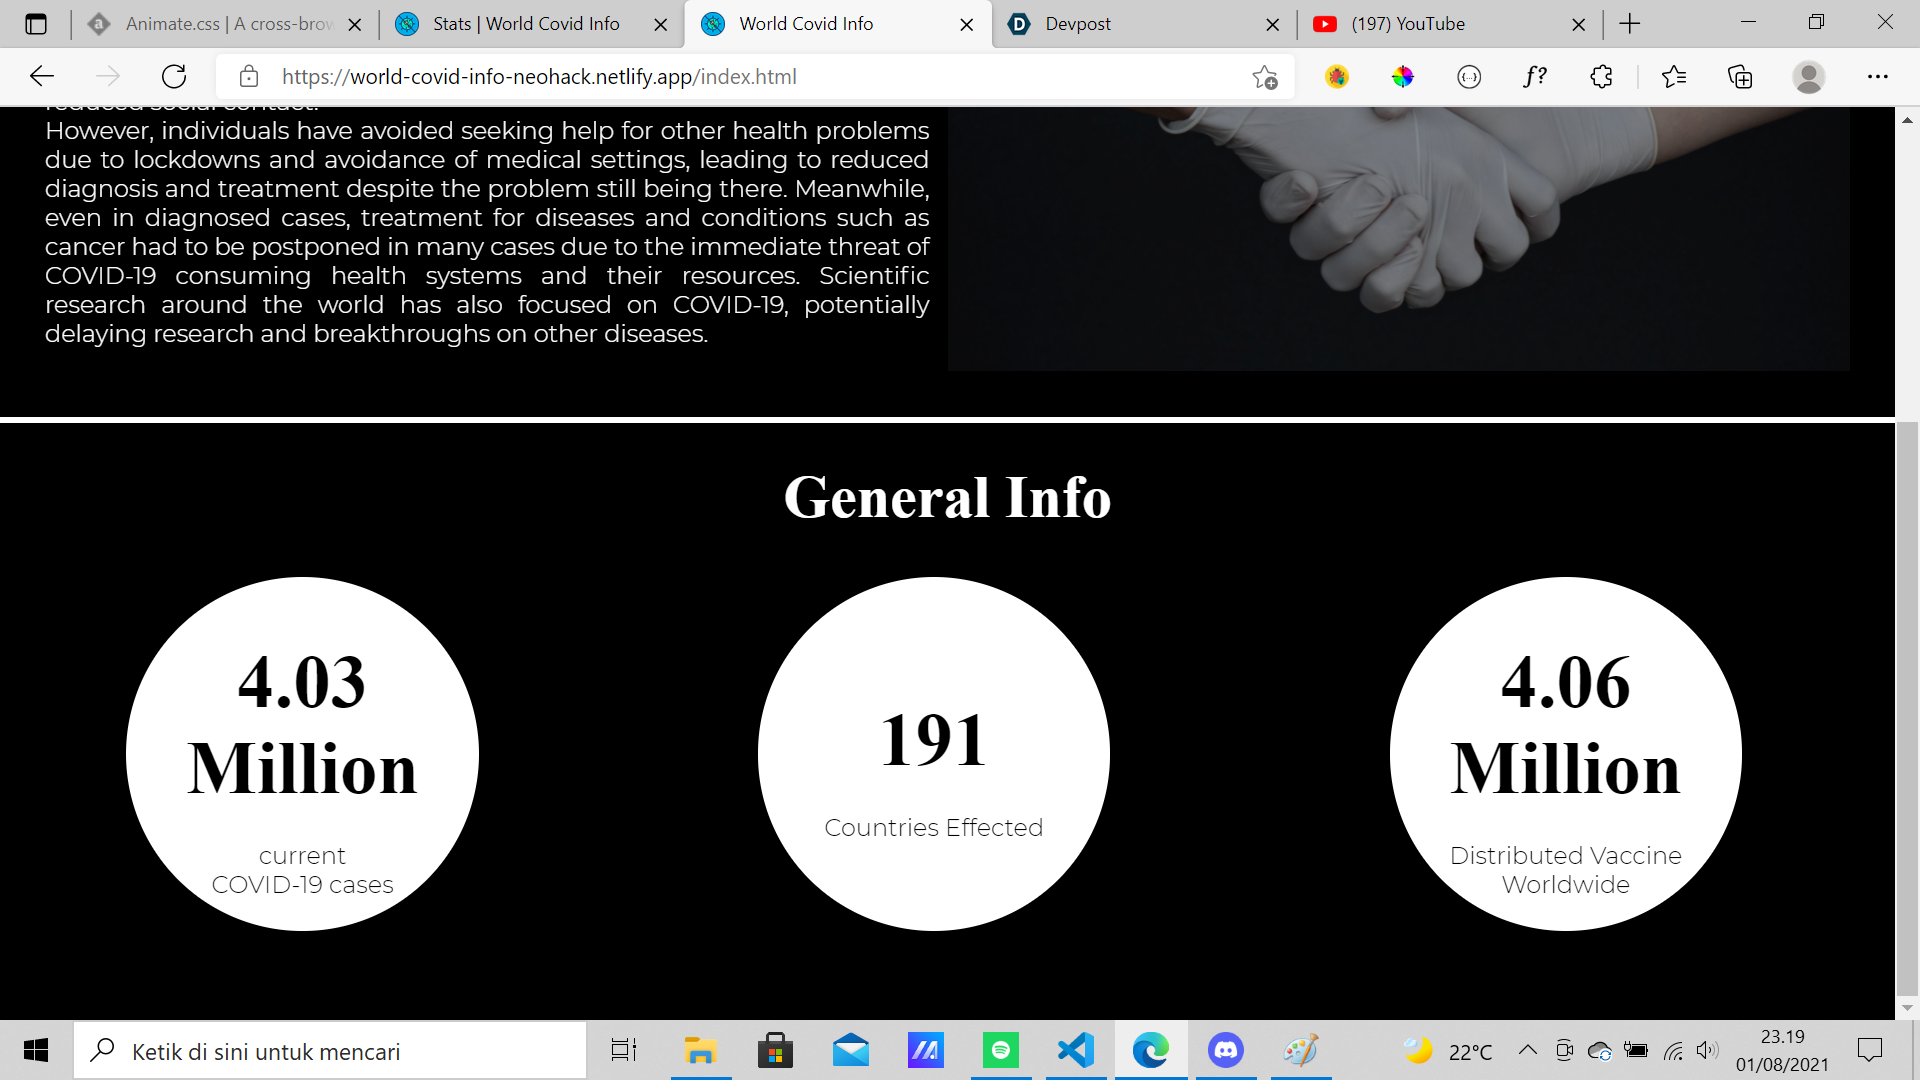
some general information on home pages
-
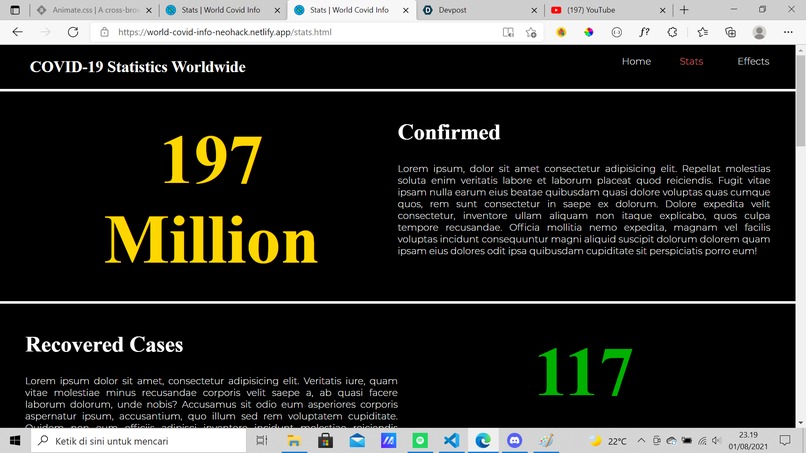
the information about the cases on the world.1
-
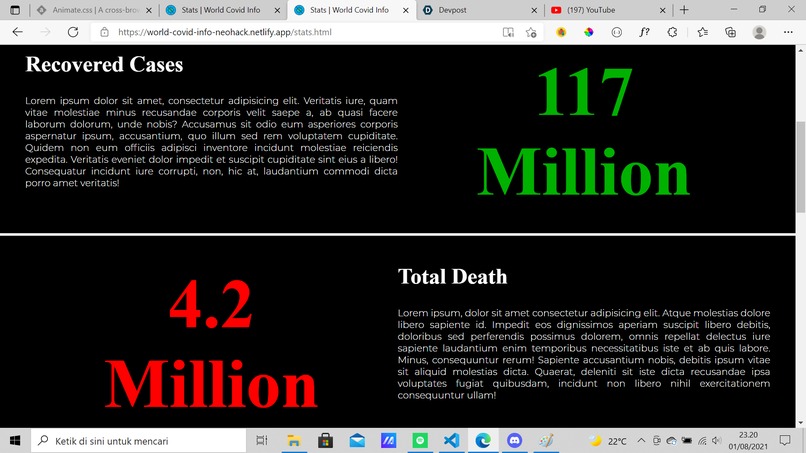
the information about the cases on the world.2
-
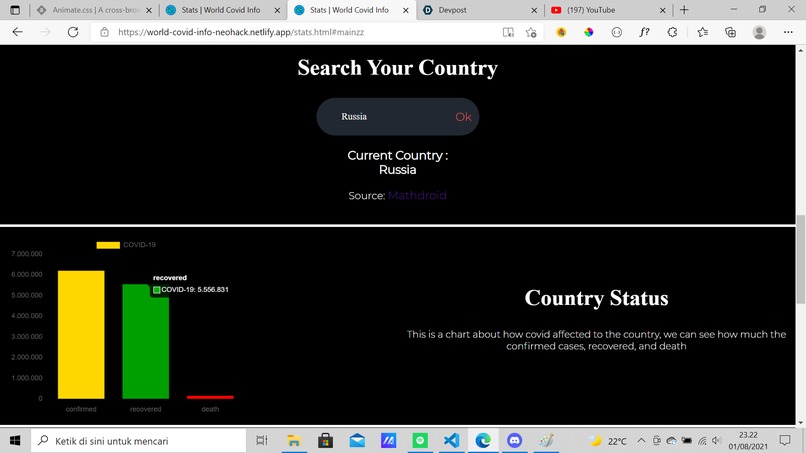
Search section: u can search your country name in there and there will be a graph for the covid cases
-

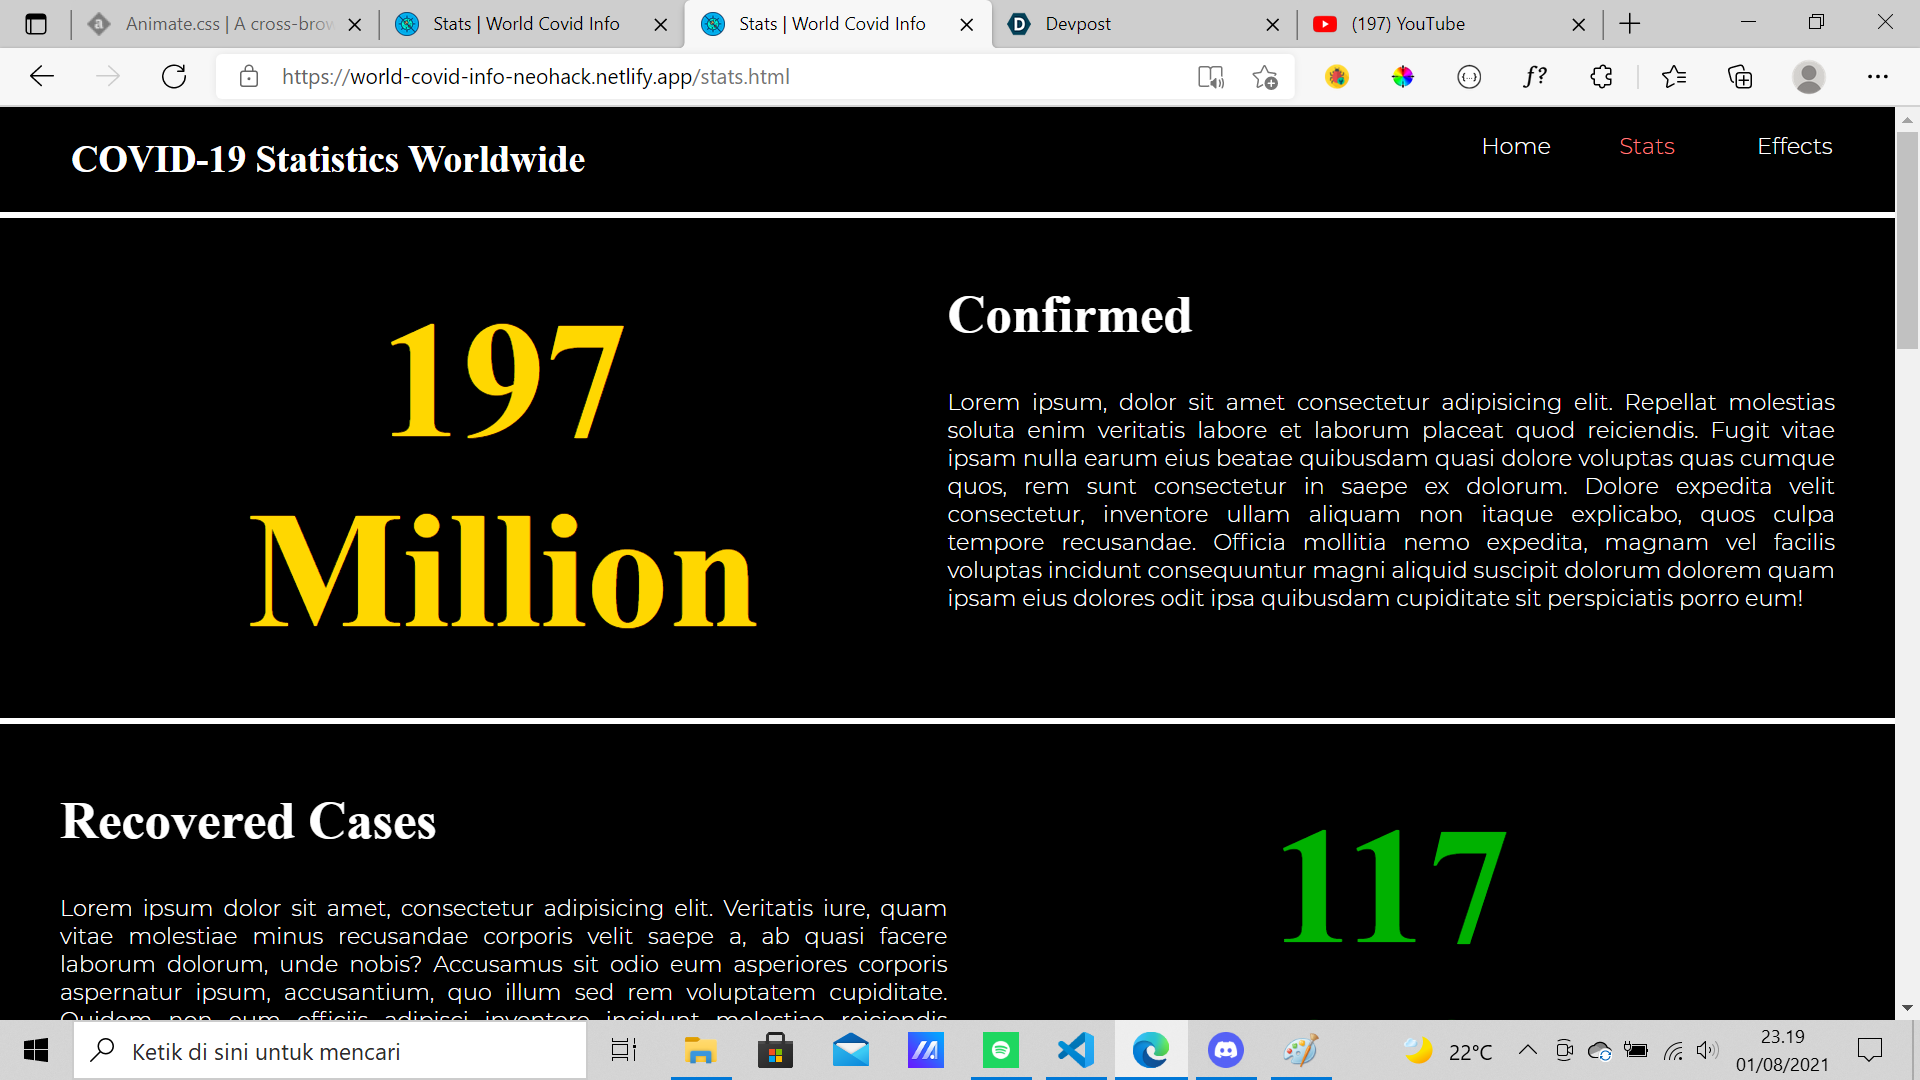
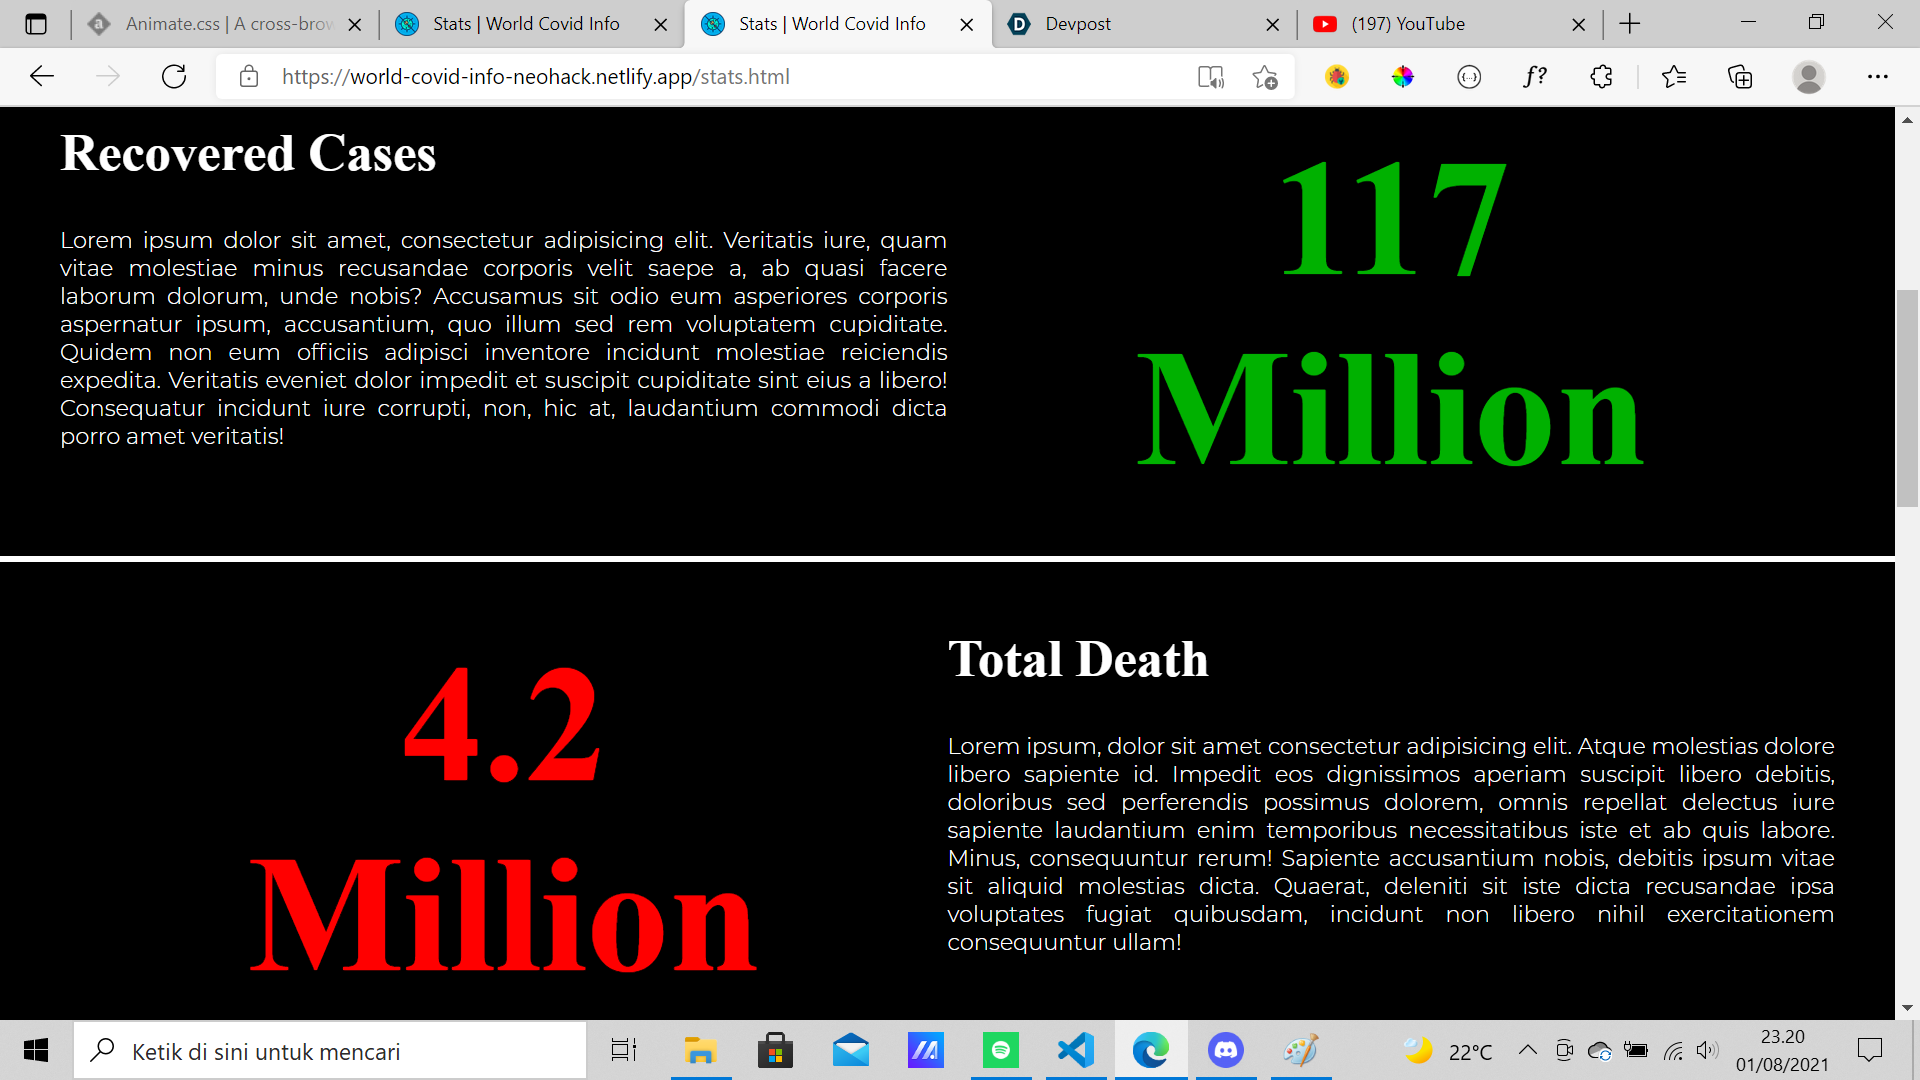
more information in statistics page
-
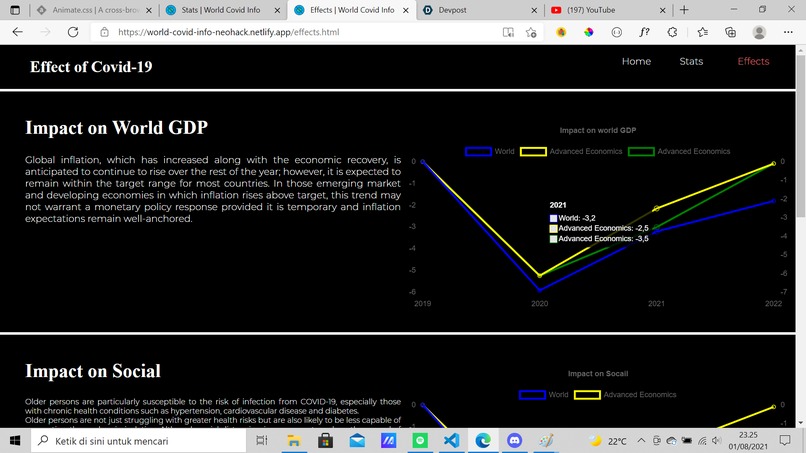
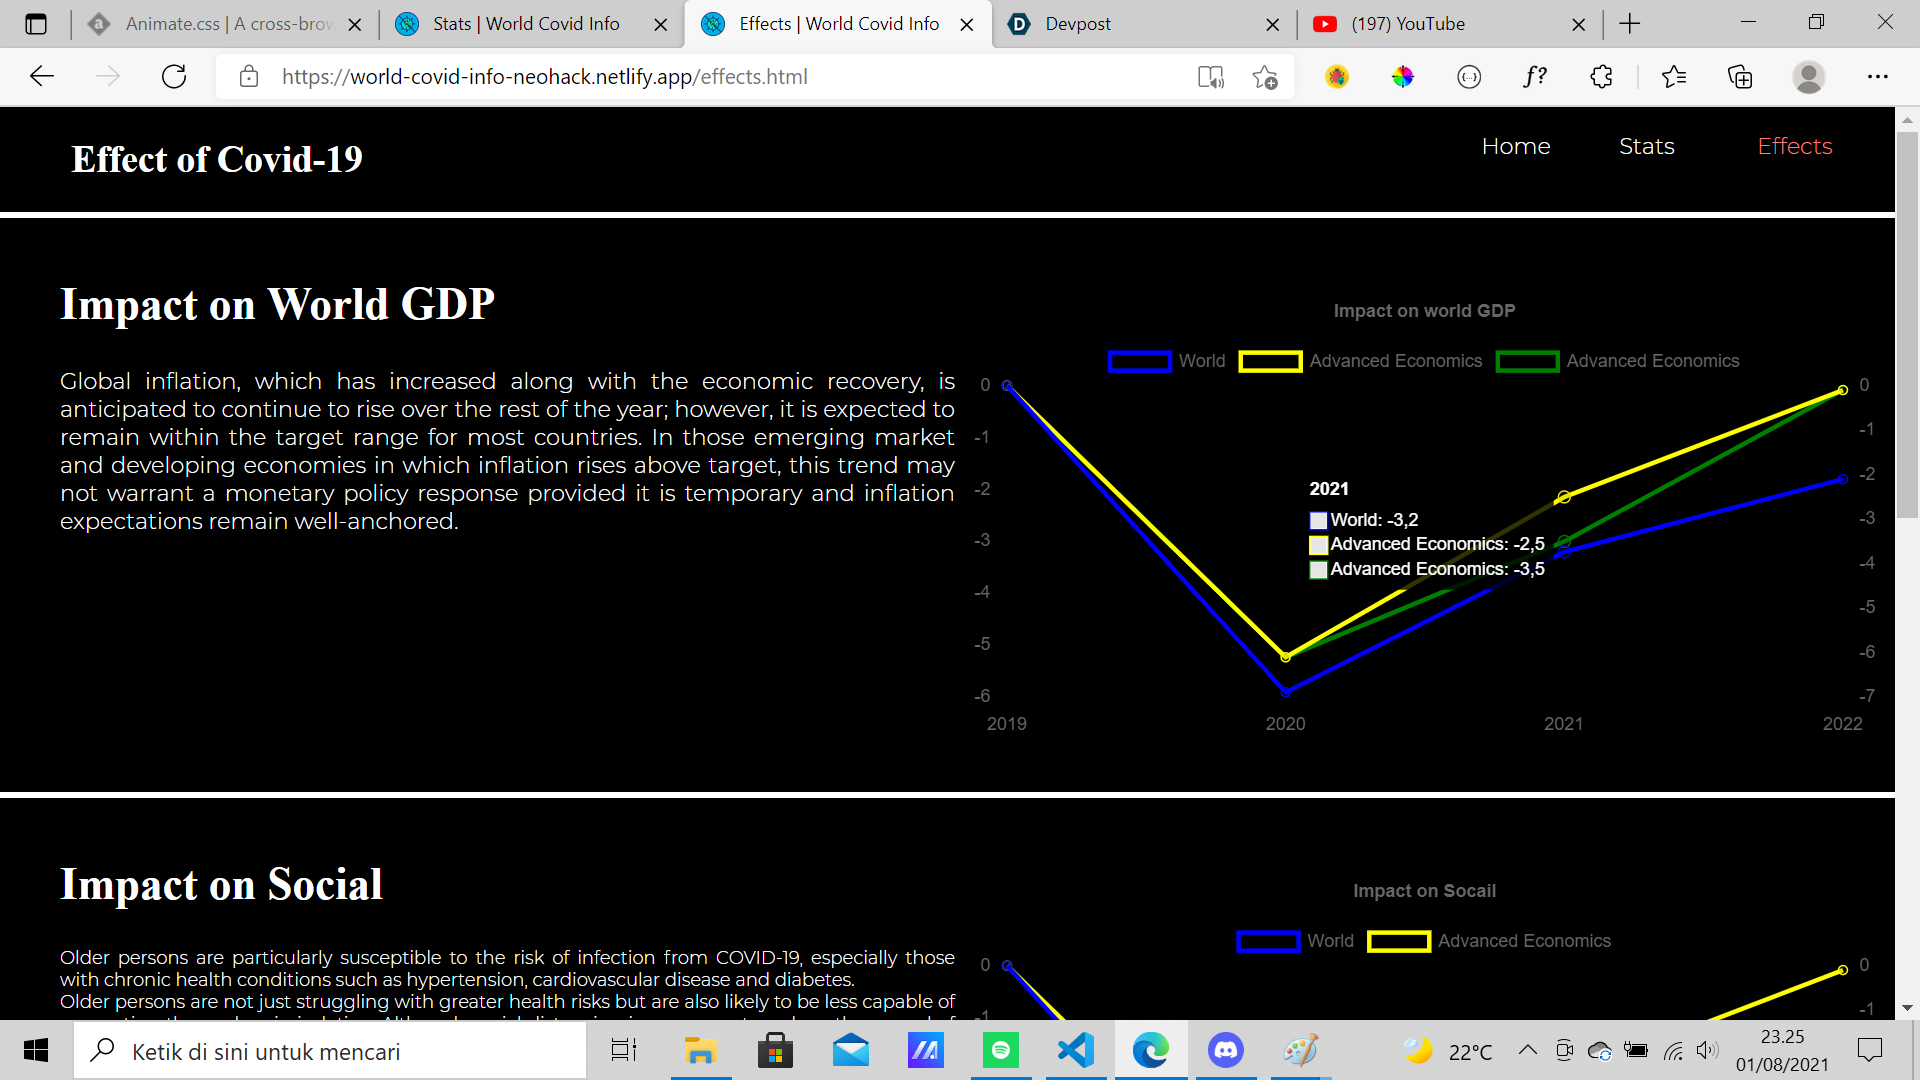
information and graph about how covid affect world gdp
-
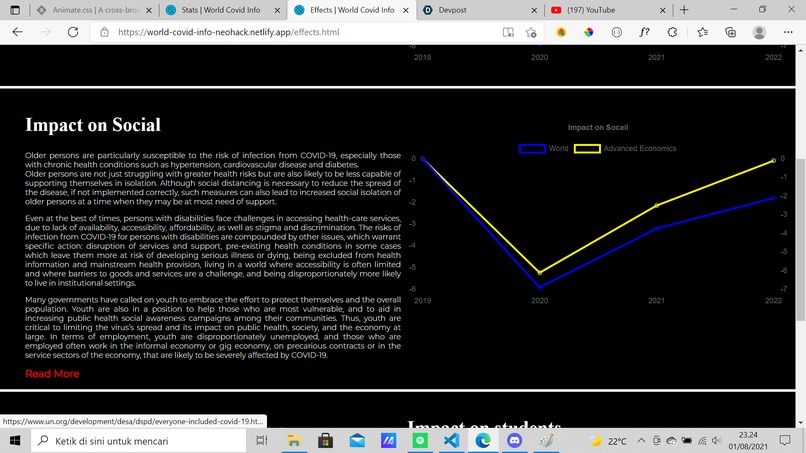
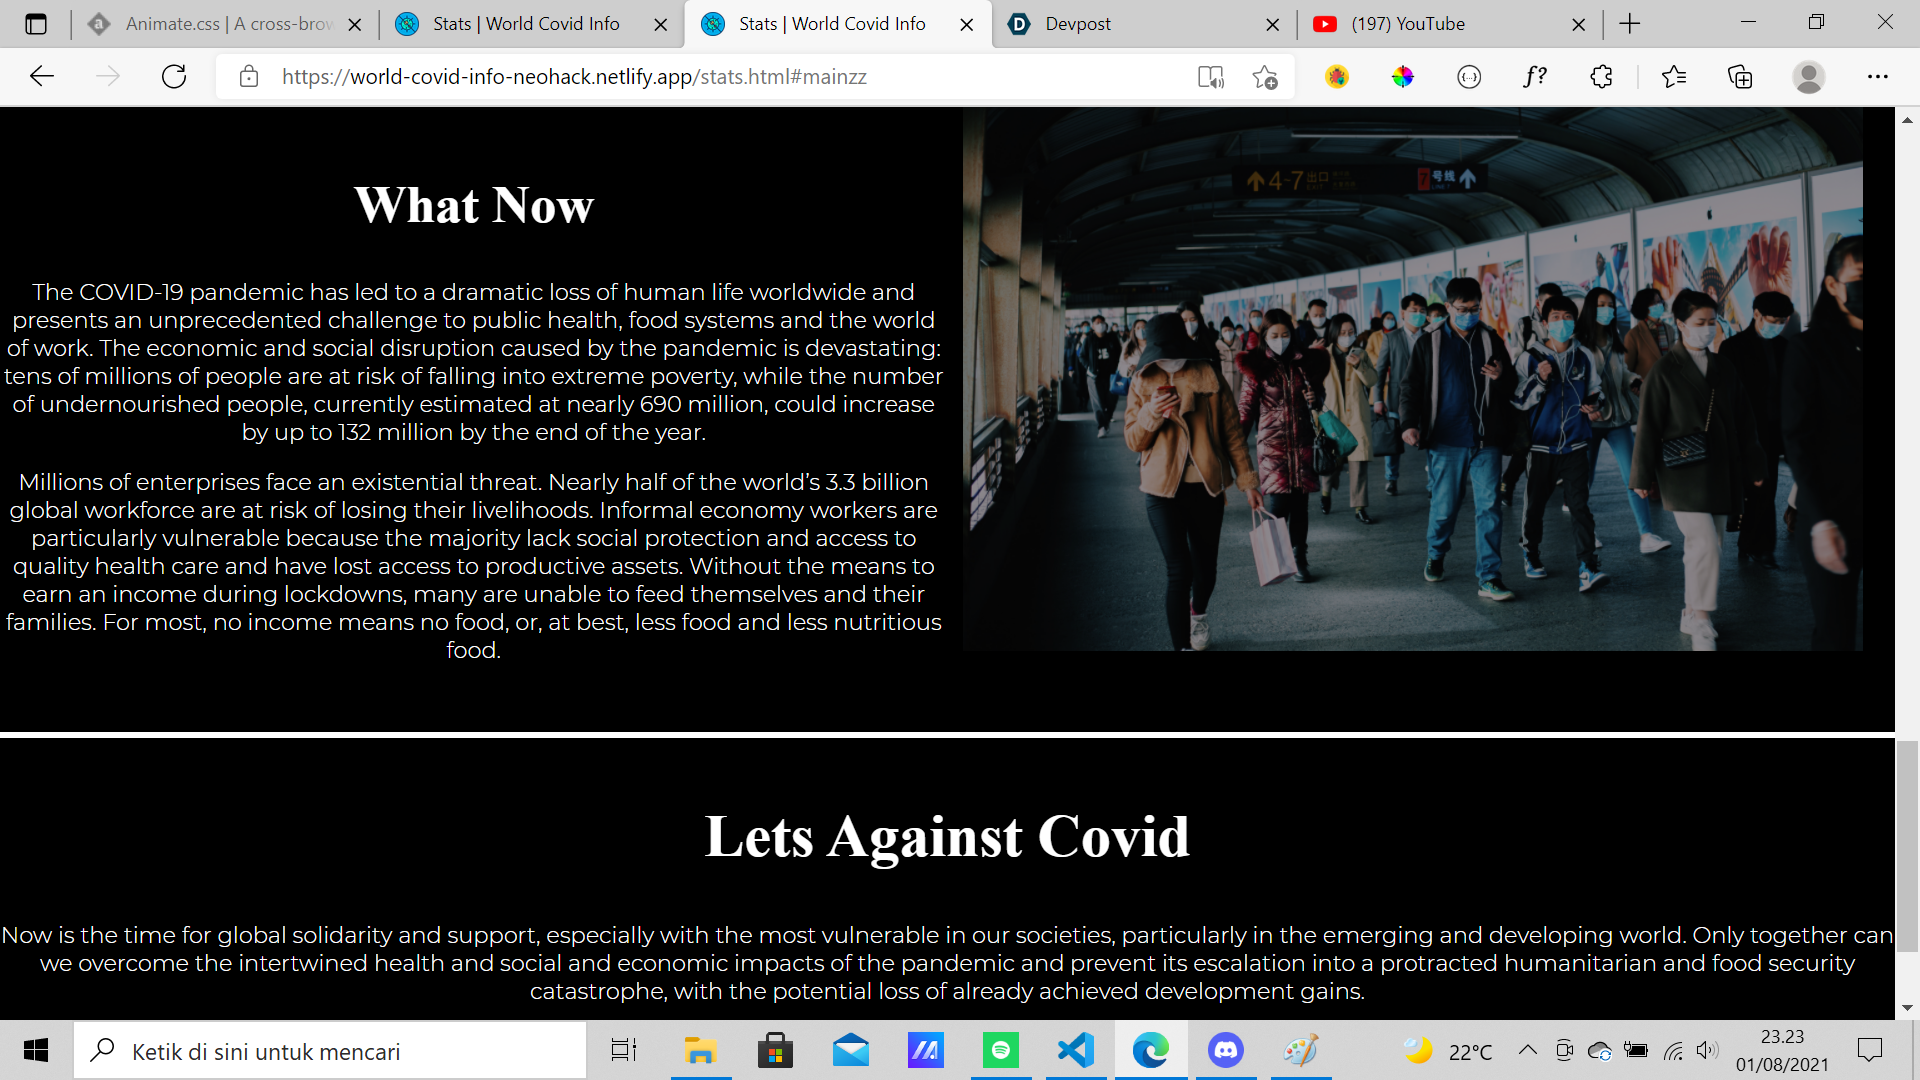
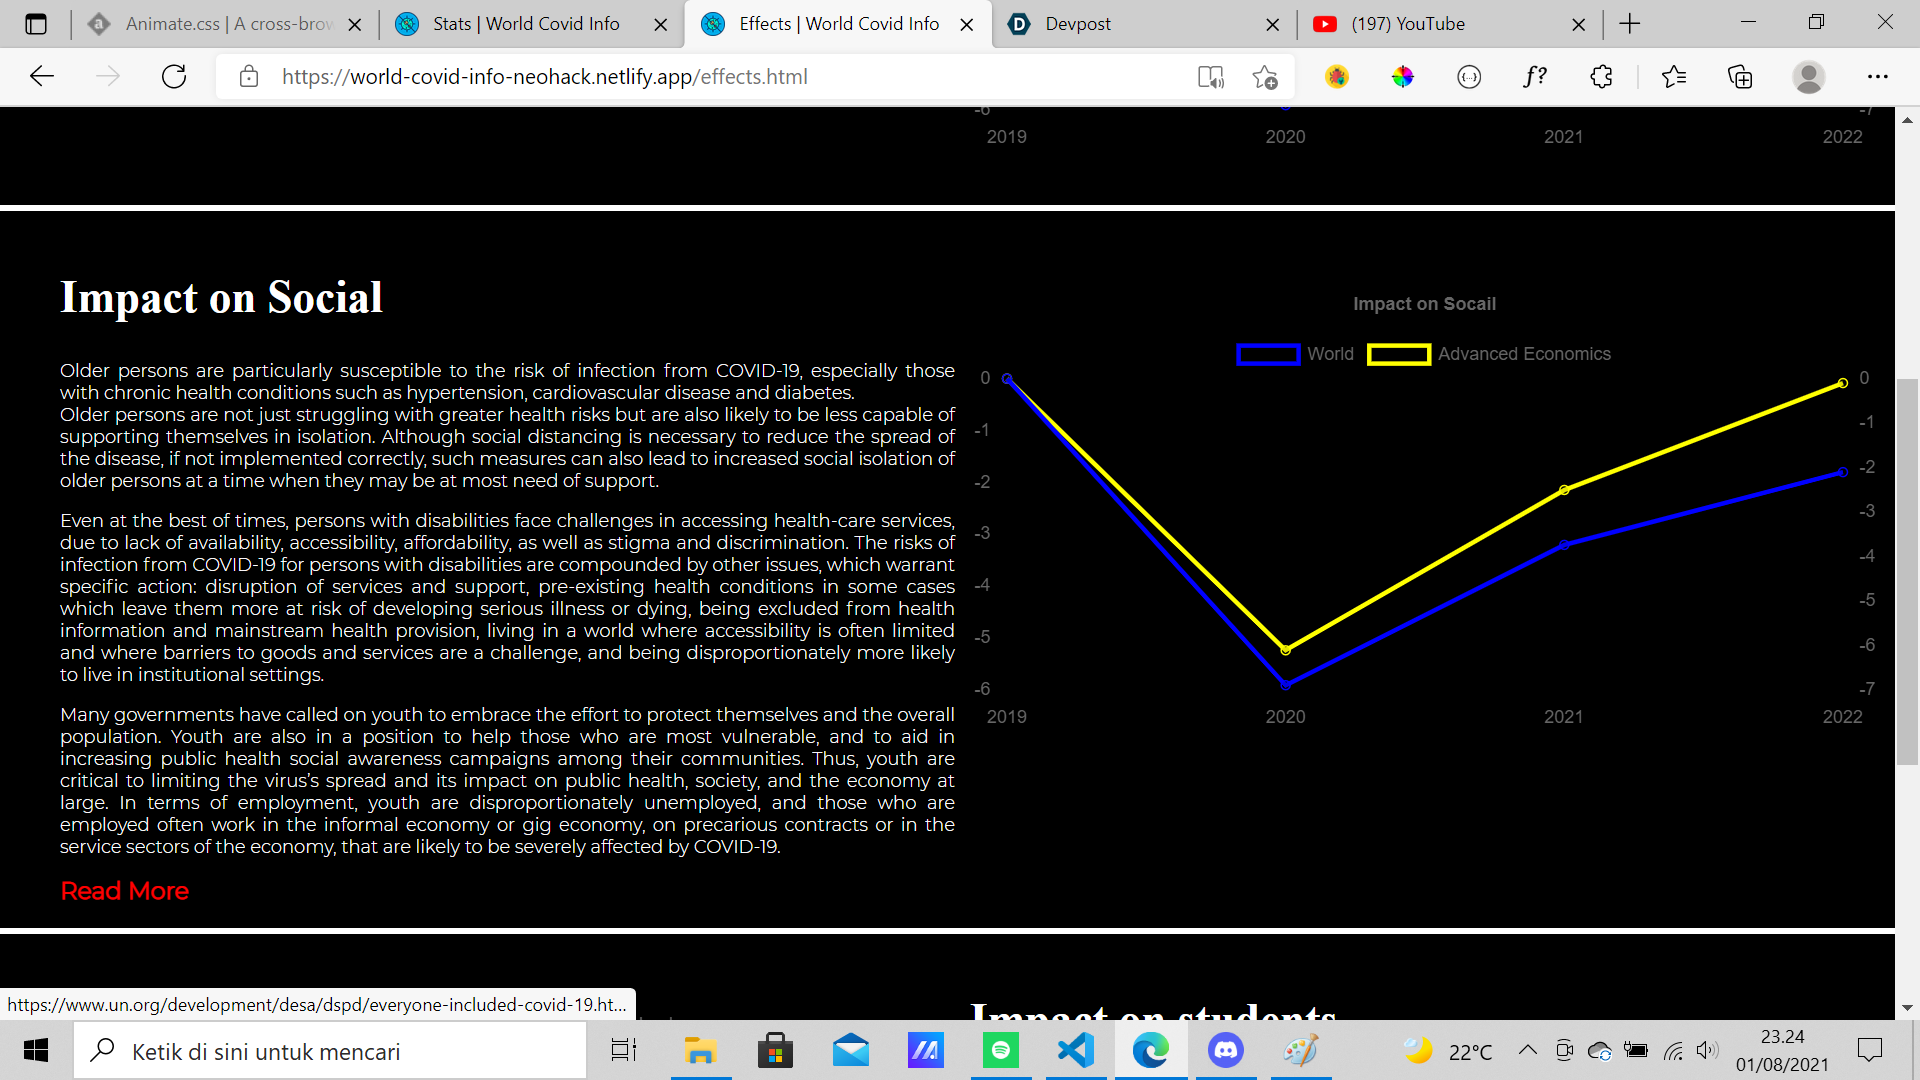
information and graph about covid impact on social lives
-
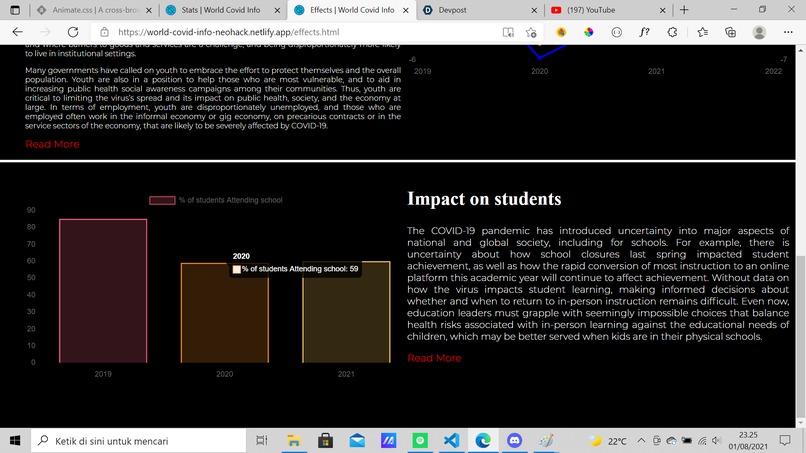
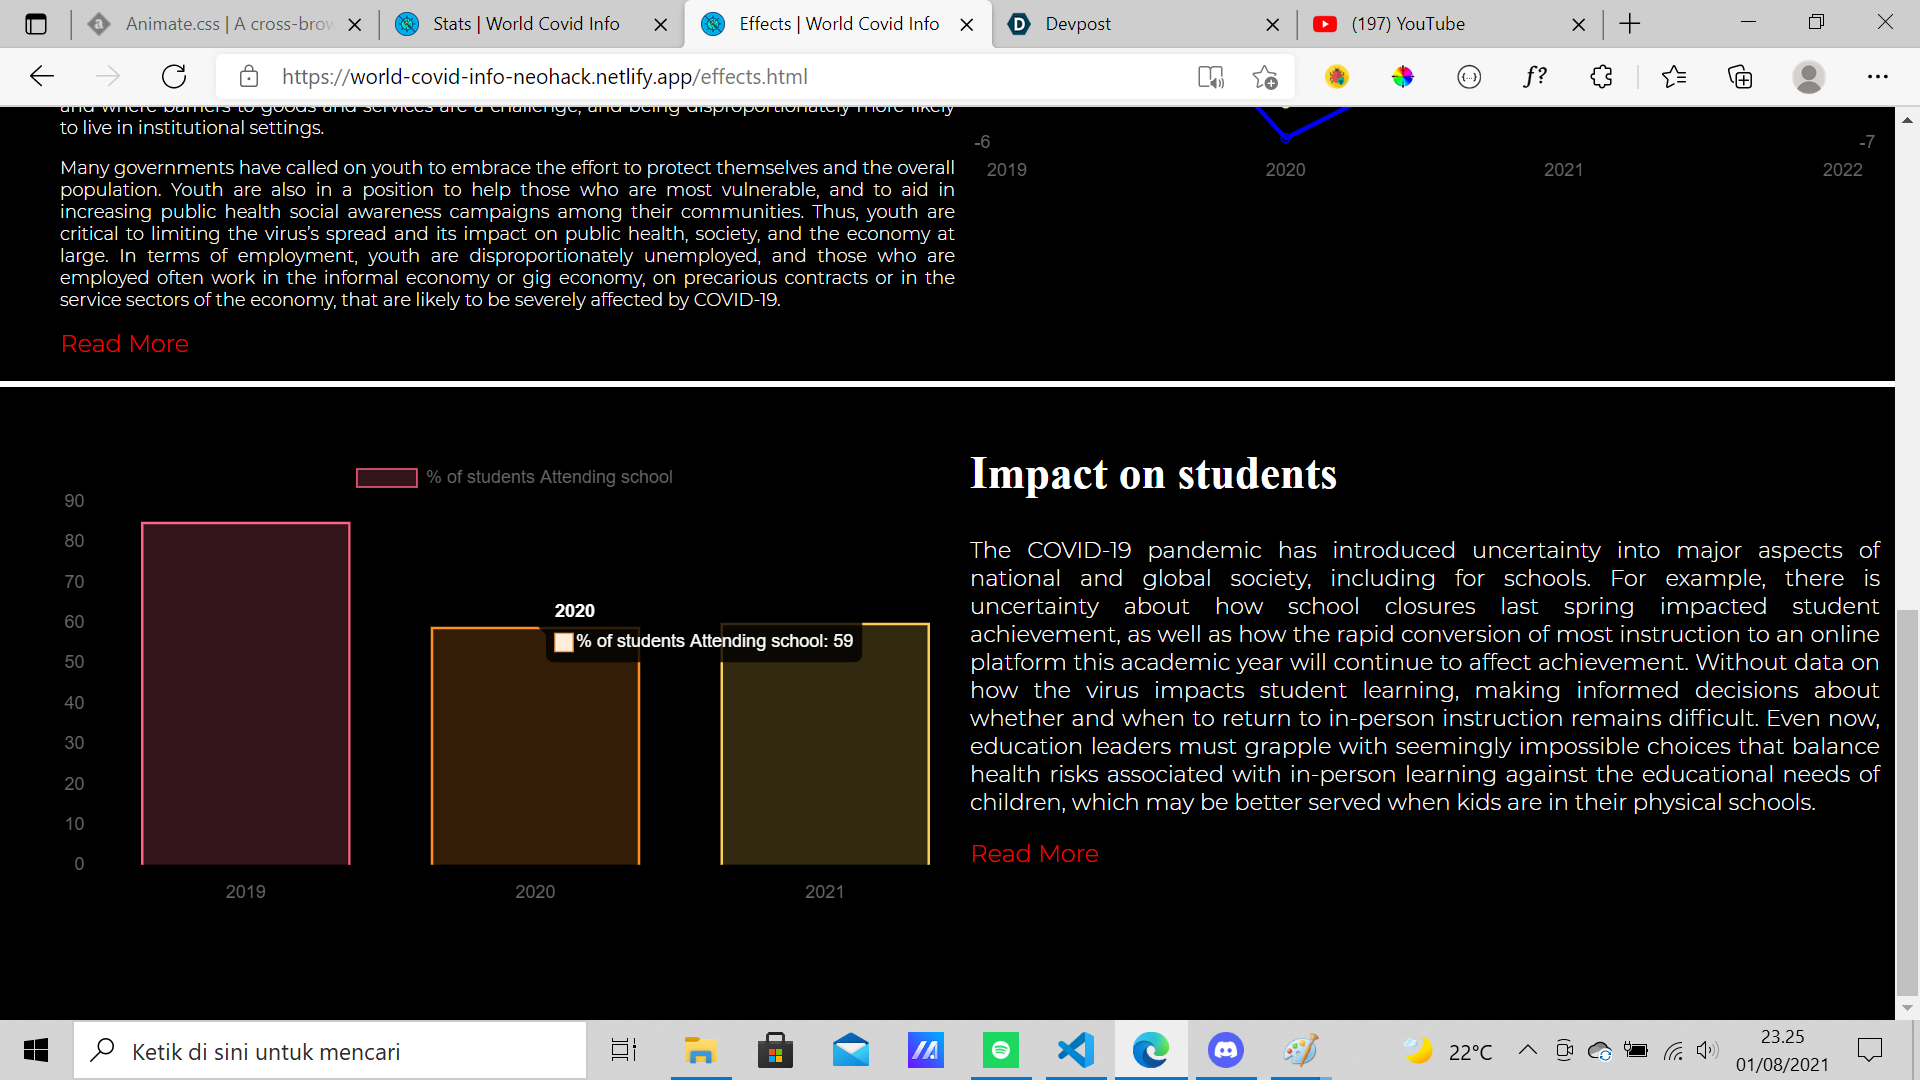
information and graph about how covid impact the students around the world

Inspiration
As a team, we realized the COVID has disrupted many parts of our everyday lives and many times, it a little difficult to get answers to questions straight off the back. We wanted to make statistics and COVID-19 information available to everyone in one place, so that it was faster and easier to understand the pandemic.
What it does
Our website displays various information about the COVID-19 Pandemic including current statistics and long term effects it has on our world.
How we built it
We started out design on Figma so we had an outline on what we were going to build then started building it in HTML, CSS, and JavaScript. For a lot of our data, we represented them in charts, for which we used Chart JS.
Challenges we ran into
Because a majority of our team is new to hacking and it was their first hackathon, it was a little confusing at first how everything worked and establishing a connection was a little daunting.
Accomplishments that we're proud of
We made this website together from scratch. We also touched the surface of how to use Figma, a tool that none of our team members had used.
What we learned
We learned that having good team work and communication helps us make you project work a little smoother and out ideas are understood faster.
What's next for World Covid Info
We may add a resource page later on so that people have access to COVID related resources.
Built With
- api
- chart.js
- covid
- css3
- html5
- javascript


Log in or sign up for Devpost to join the conversation.