-
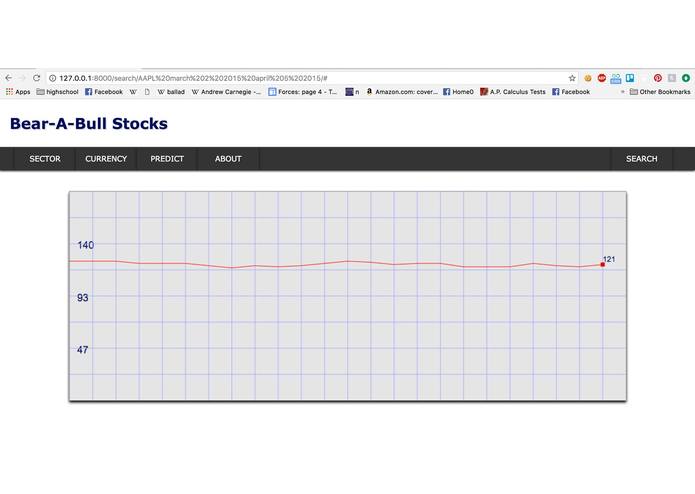
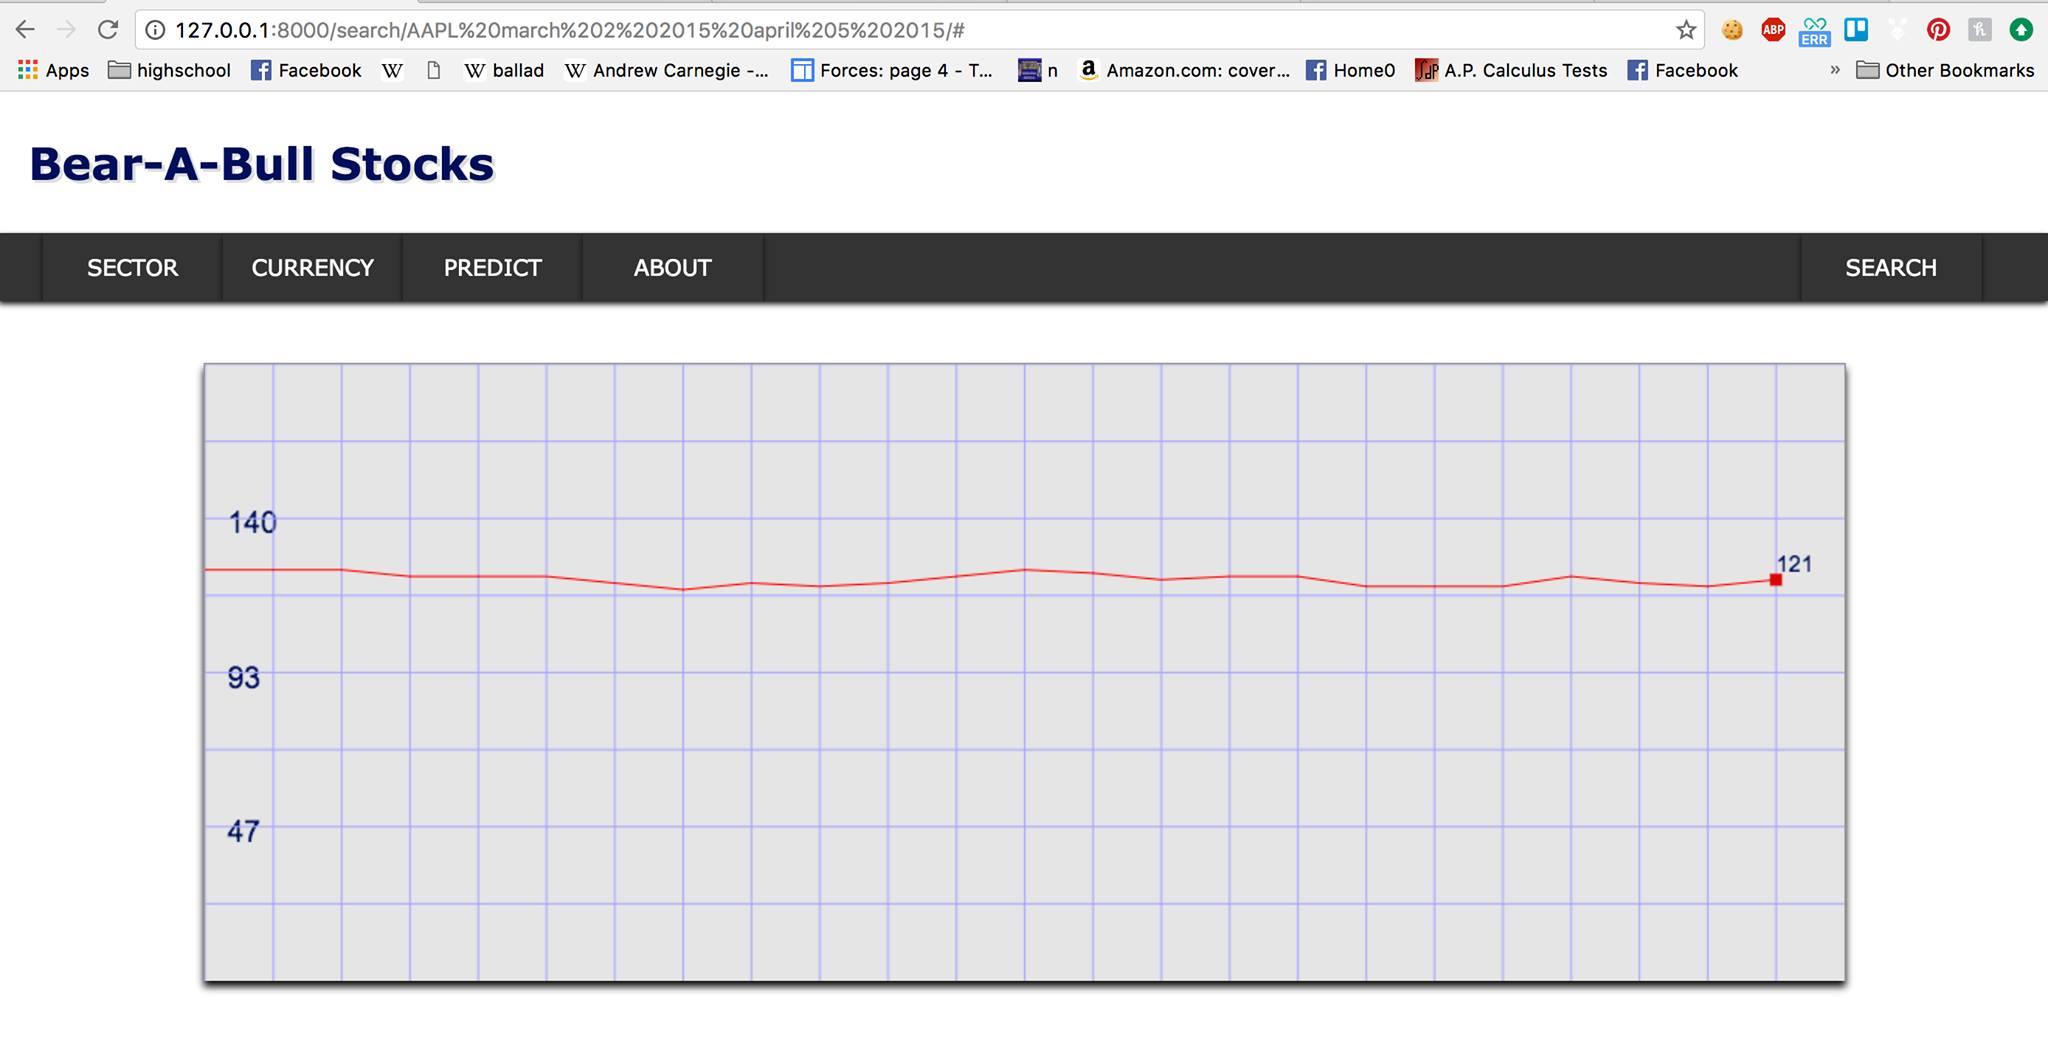
Screenshot of our demo website
Inspiration
"Saving is a great habit but without investing and tracking, it just sleeps" - Manoj Arora
Many Americans don't engage with the stock market. In fact, according to CNN, less than half of all Americans had money invested in the market in 2015.
A significant factor in this decision to stay away from the market is a lack of security. To many, looking at the seemingly arbitrary numbers and graphs as they fluctuate over time is simply unintelligible, or even discouraging. The average citizen doesn't have the time or interest to really study what these numbers mean relate it to their more concrete experiences, and hiring an investment firm to manage investments can be an expensive ordeal in itself. As it stands, Americans face too great of a barrier to entry to get into the stock market.
Vesta lowers the barrier to entry for potential investors by making large amounts of data easy to digest. Groups that may not yet have had opportunity to explore long-term investments, such as the young and socioeconomically disadvantaged, are the primary audience for Vesta.
What it does
Vesta is a fairly simple concept. Our website allows users to select a stock and select a time frame. Vesta then generates a time graph of the stock price overlaid with headlines of the most prominent events of the day, which provides a fast and easy way for the user to find out what happened in the real world and, simultaneously, what happened in the market.
Vesta empowers the user to ask, for example, "what happened when that stock took such a steep dip last week?" and find real-world, qualitative answers that might help explain what he/she sees. Using a New York Times API with articles published from the 1850s to the present day (continuously updating), Vesta is able to provide valuable historical perspective as well as current data to the user in an intuitive way.
How we built it
First, we created a retrieval file in python that interfaces with the New York Times API and returns usable article data. From this data, we removed all of the boring words ("as", "the", "and") and then conducted a sentiment analysis on the remaining words in the first paragraph of the article.
While working on this substantial retrieval file, we also employed and created the necessary tools for properly plotting the stock data in a visually appealing format.
With the stock plotting and article analysis capabilities completed, we then began integrating the two and deciding when to actually add the title of the NYT article to the graph. We decided to trigger this addition by detecting a percent change that exceeds a given threshold. If the stock changed more than, say, 2% on the day for example, then Vesta would label that specific area in the graph with the most popular article of that day.
Challenges we ran into
One of the biggest challenges we faced during this hackathon was physical. Everyone on the team struggled to stay engaged after being awake for 24 hours, and trying to strike a good balance between working through the grogginess and taking time to recharge was tricky.
On a technical side, every step along the way had its own set of challenges. Interfacing between the JS front end and the Django back end was particularly difficult, and getting everything to cooperate took much longer than expected.
Accomplishments that we're proud of
We are very proud of how much Red Bull we drank during this hackathon.
Also, this project turned out to be much more technically challenging than anticipated. We didn't reach as many final goals as we originally aimed for, but we are proud of how we worked together as a team and stayed the course through each new road block that came up.
What we learned
Jay: I learned a lot about Django and working in a team, and I think I picked up some Python website scraping as well. I also finally understood how Git works.
Duke: I learned about the fundamentals of back-end web development and worked on refining my skills in web scraping and data analytics. I also learned about how to improvise code on the fly and how to debug in a multi-programmer, dynamic work environment.
Aria: I learned a lot about sentiment analysis, web scraping, and visualizing data in the back end using the data science libraries. The hardest challenge though was linking the back-end to the front-end.
Tawm: VandyHacks 3 was my first hackathon, and I learned a ton about how CS gets done in the real world. Before VandyHacks, I had taken CS classes and had a tenuous grasp on computer logic, but being immersed in this challenging environment was completely different from anything I had seen before. I learned that getting programs to run properly is a tough job, and it's the little victories throughout the project that keep you going.
What's next for Vesta
We would like to improve the quality of visualizations and make them more interactive for the user. Next steps might include adding support for multiple stocks on the same graph, aesthetic adjustments, and including a better UI for down-selecting the data that the user wants to see.
Another next step for Vesta is to include a sentiment analysis of the news articles and finish out the display for the qualitative information. We have made a great deal of progress towards this goal but were unable to work out the last few bugs before the end of the hackathon.
Finally, we would like to create a user login service so users can create personalized pages to track the stocks that they are most interested in.


Log in or sign up for Devpost to join the conversation.