-
-
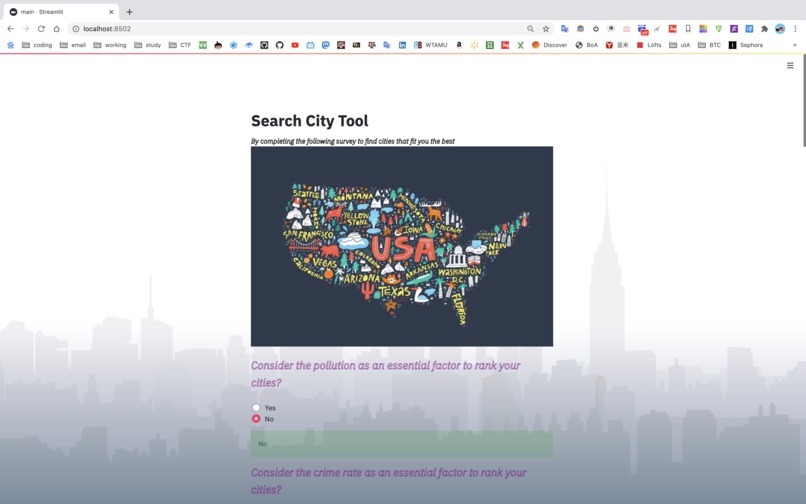
main page
-
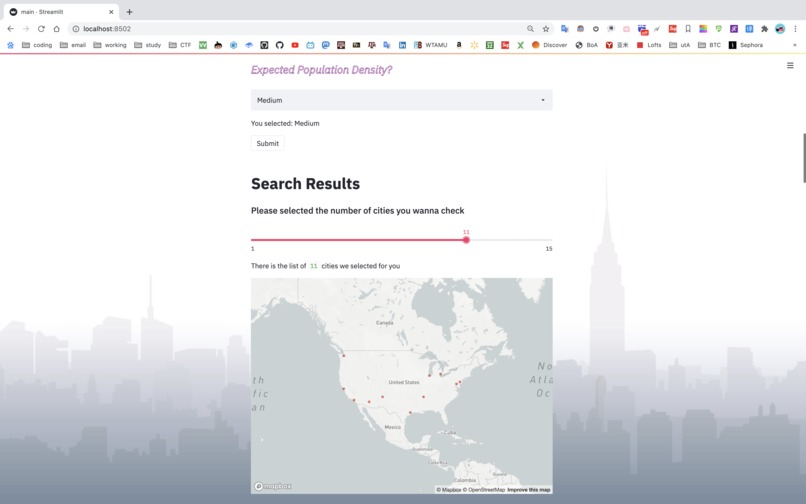
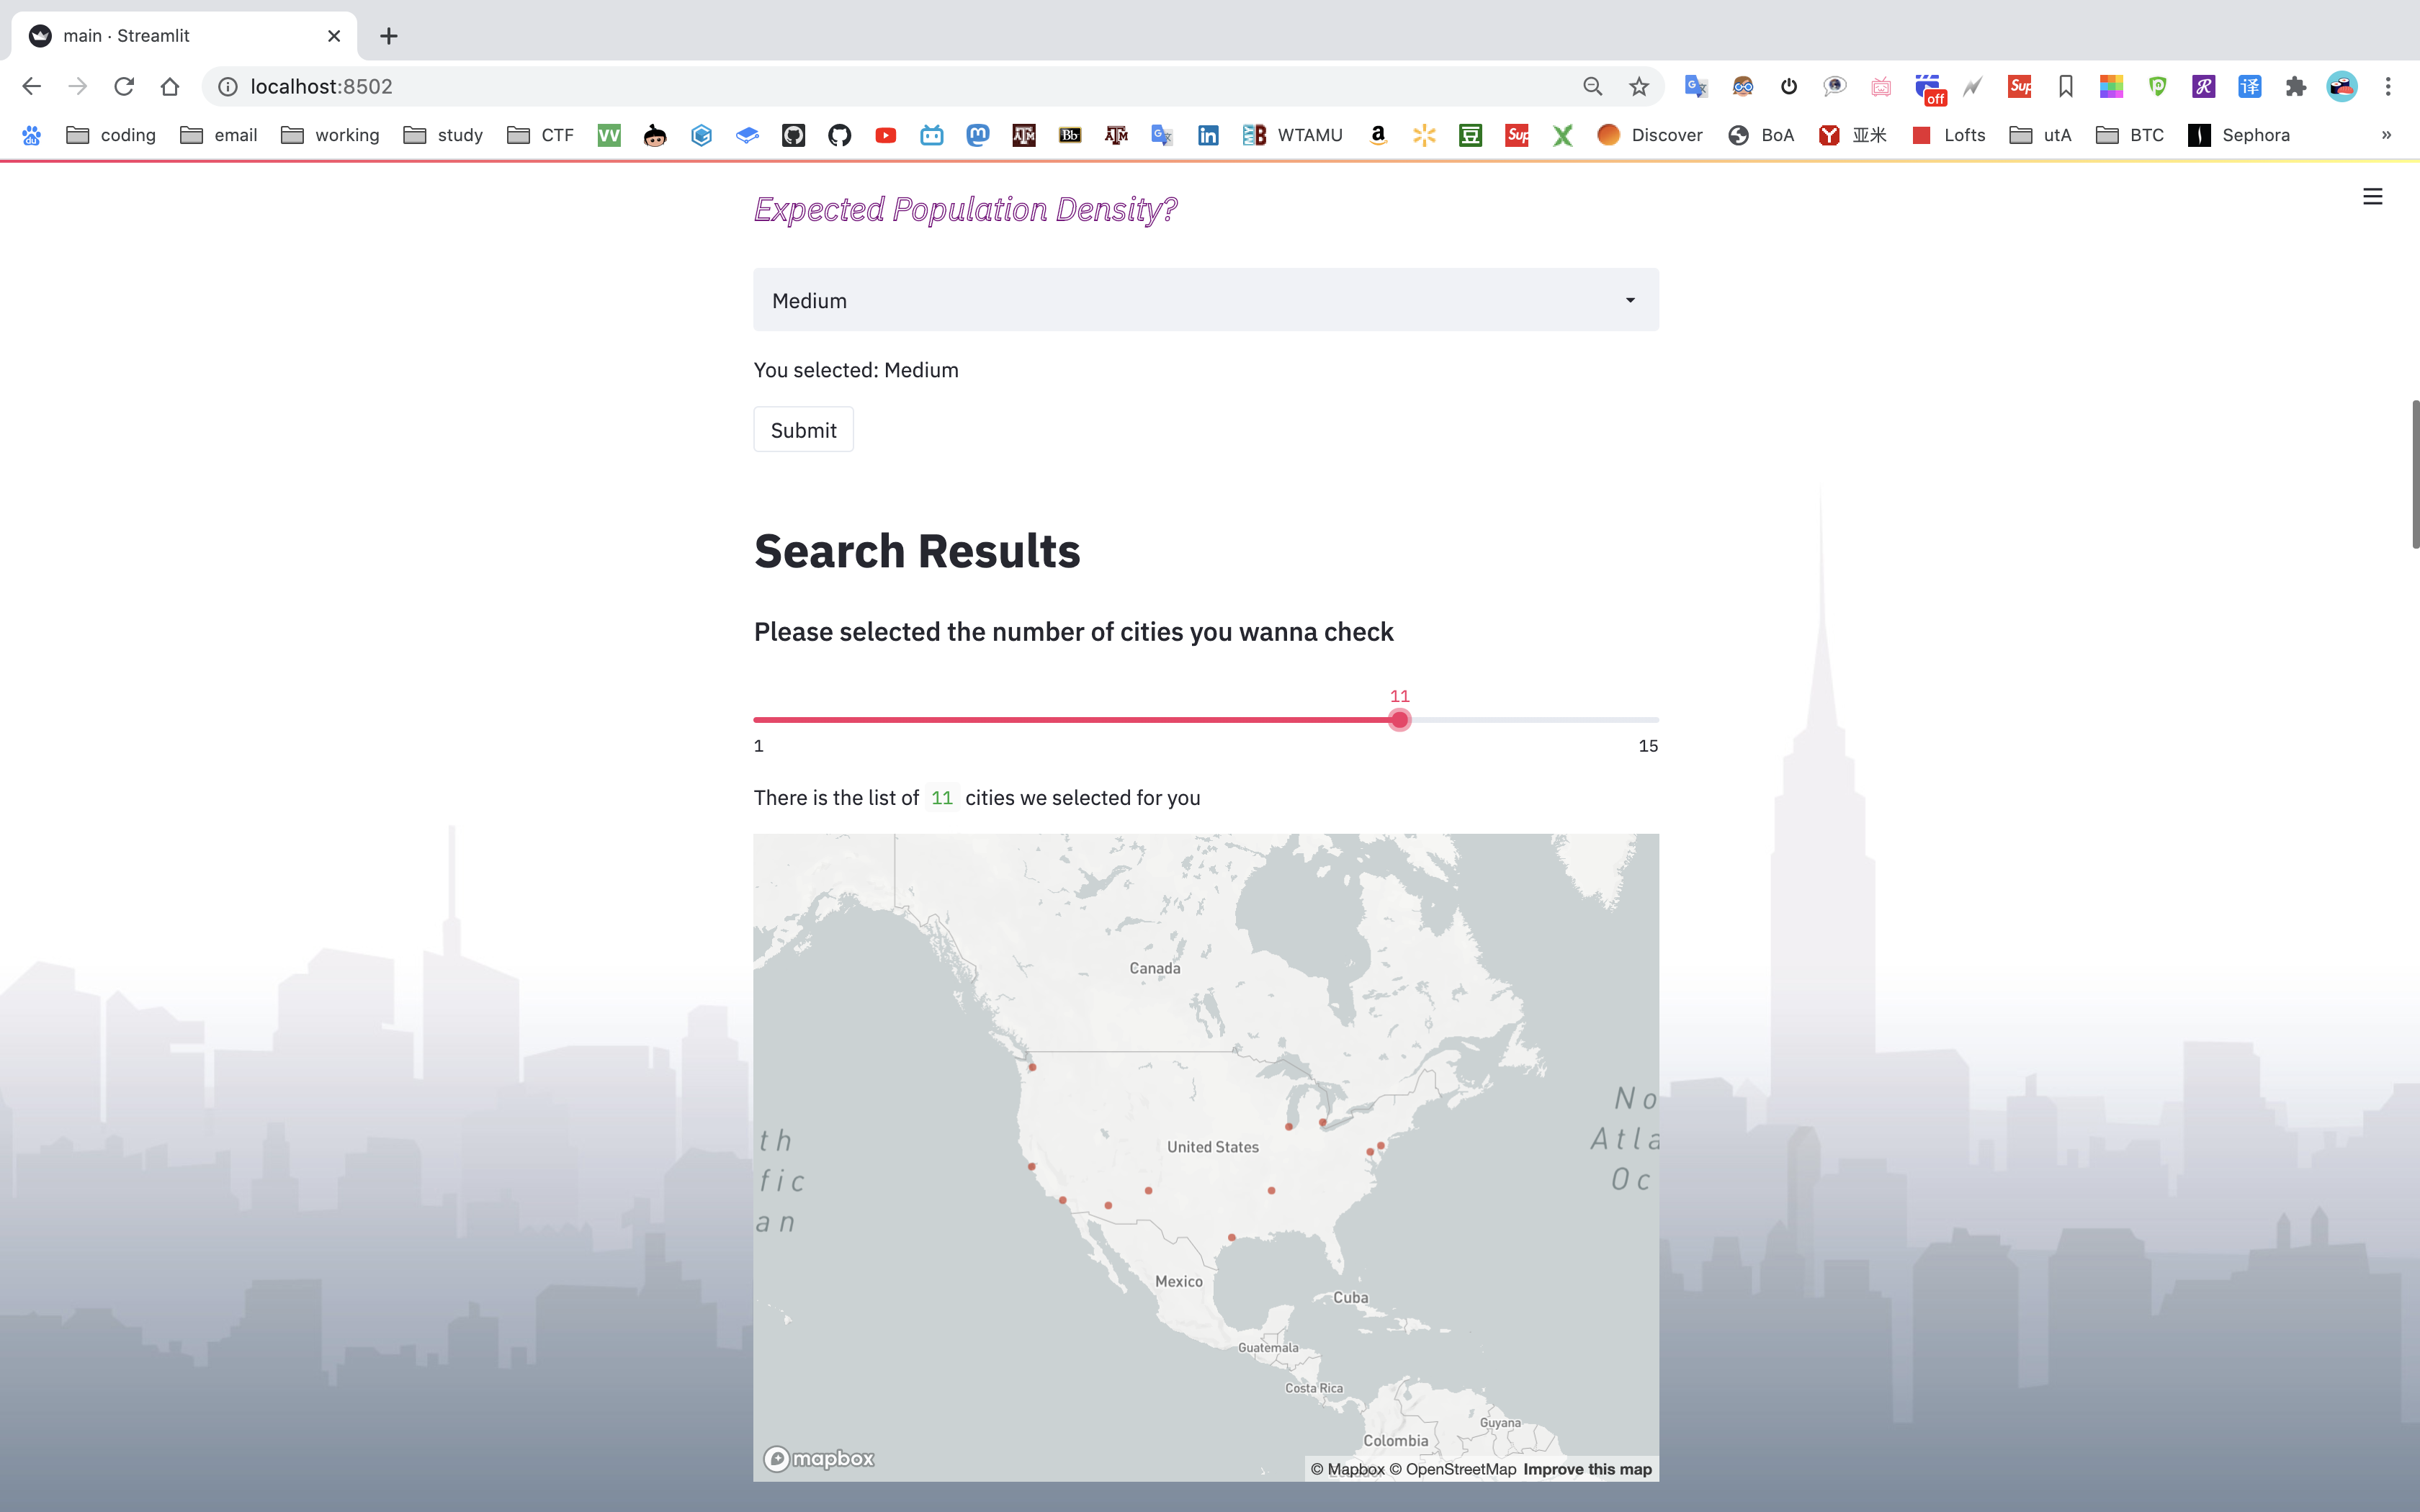
Search result with map
-
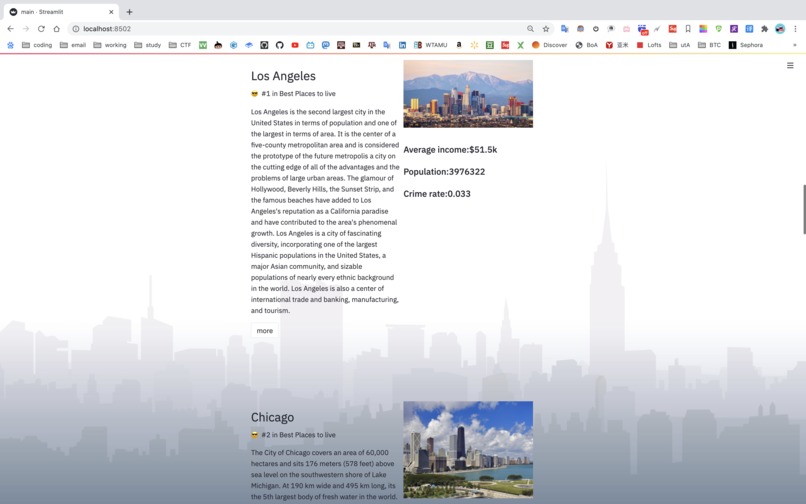
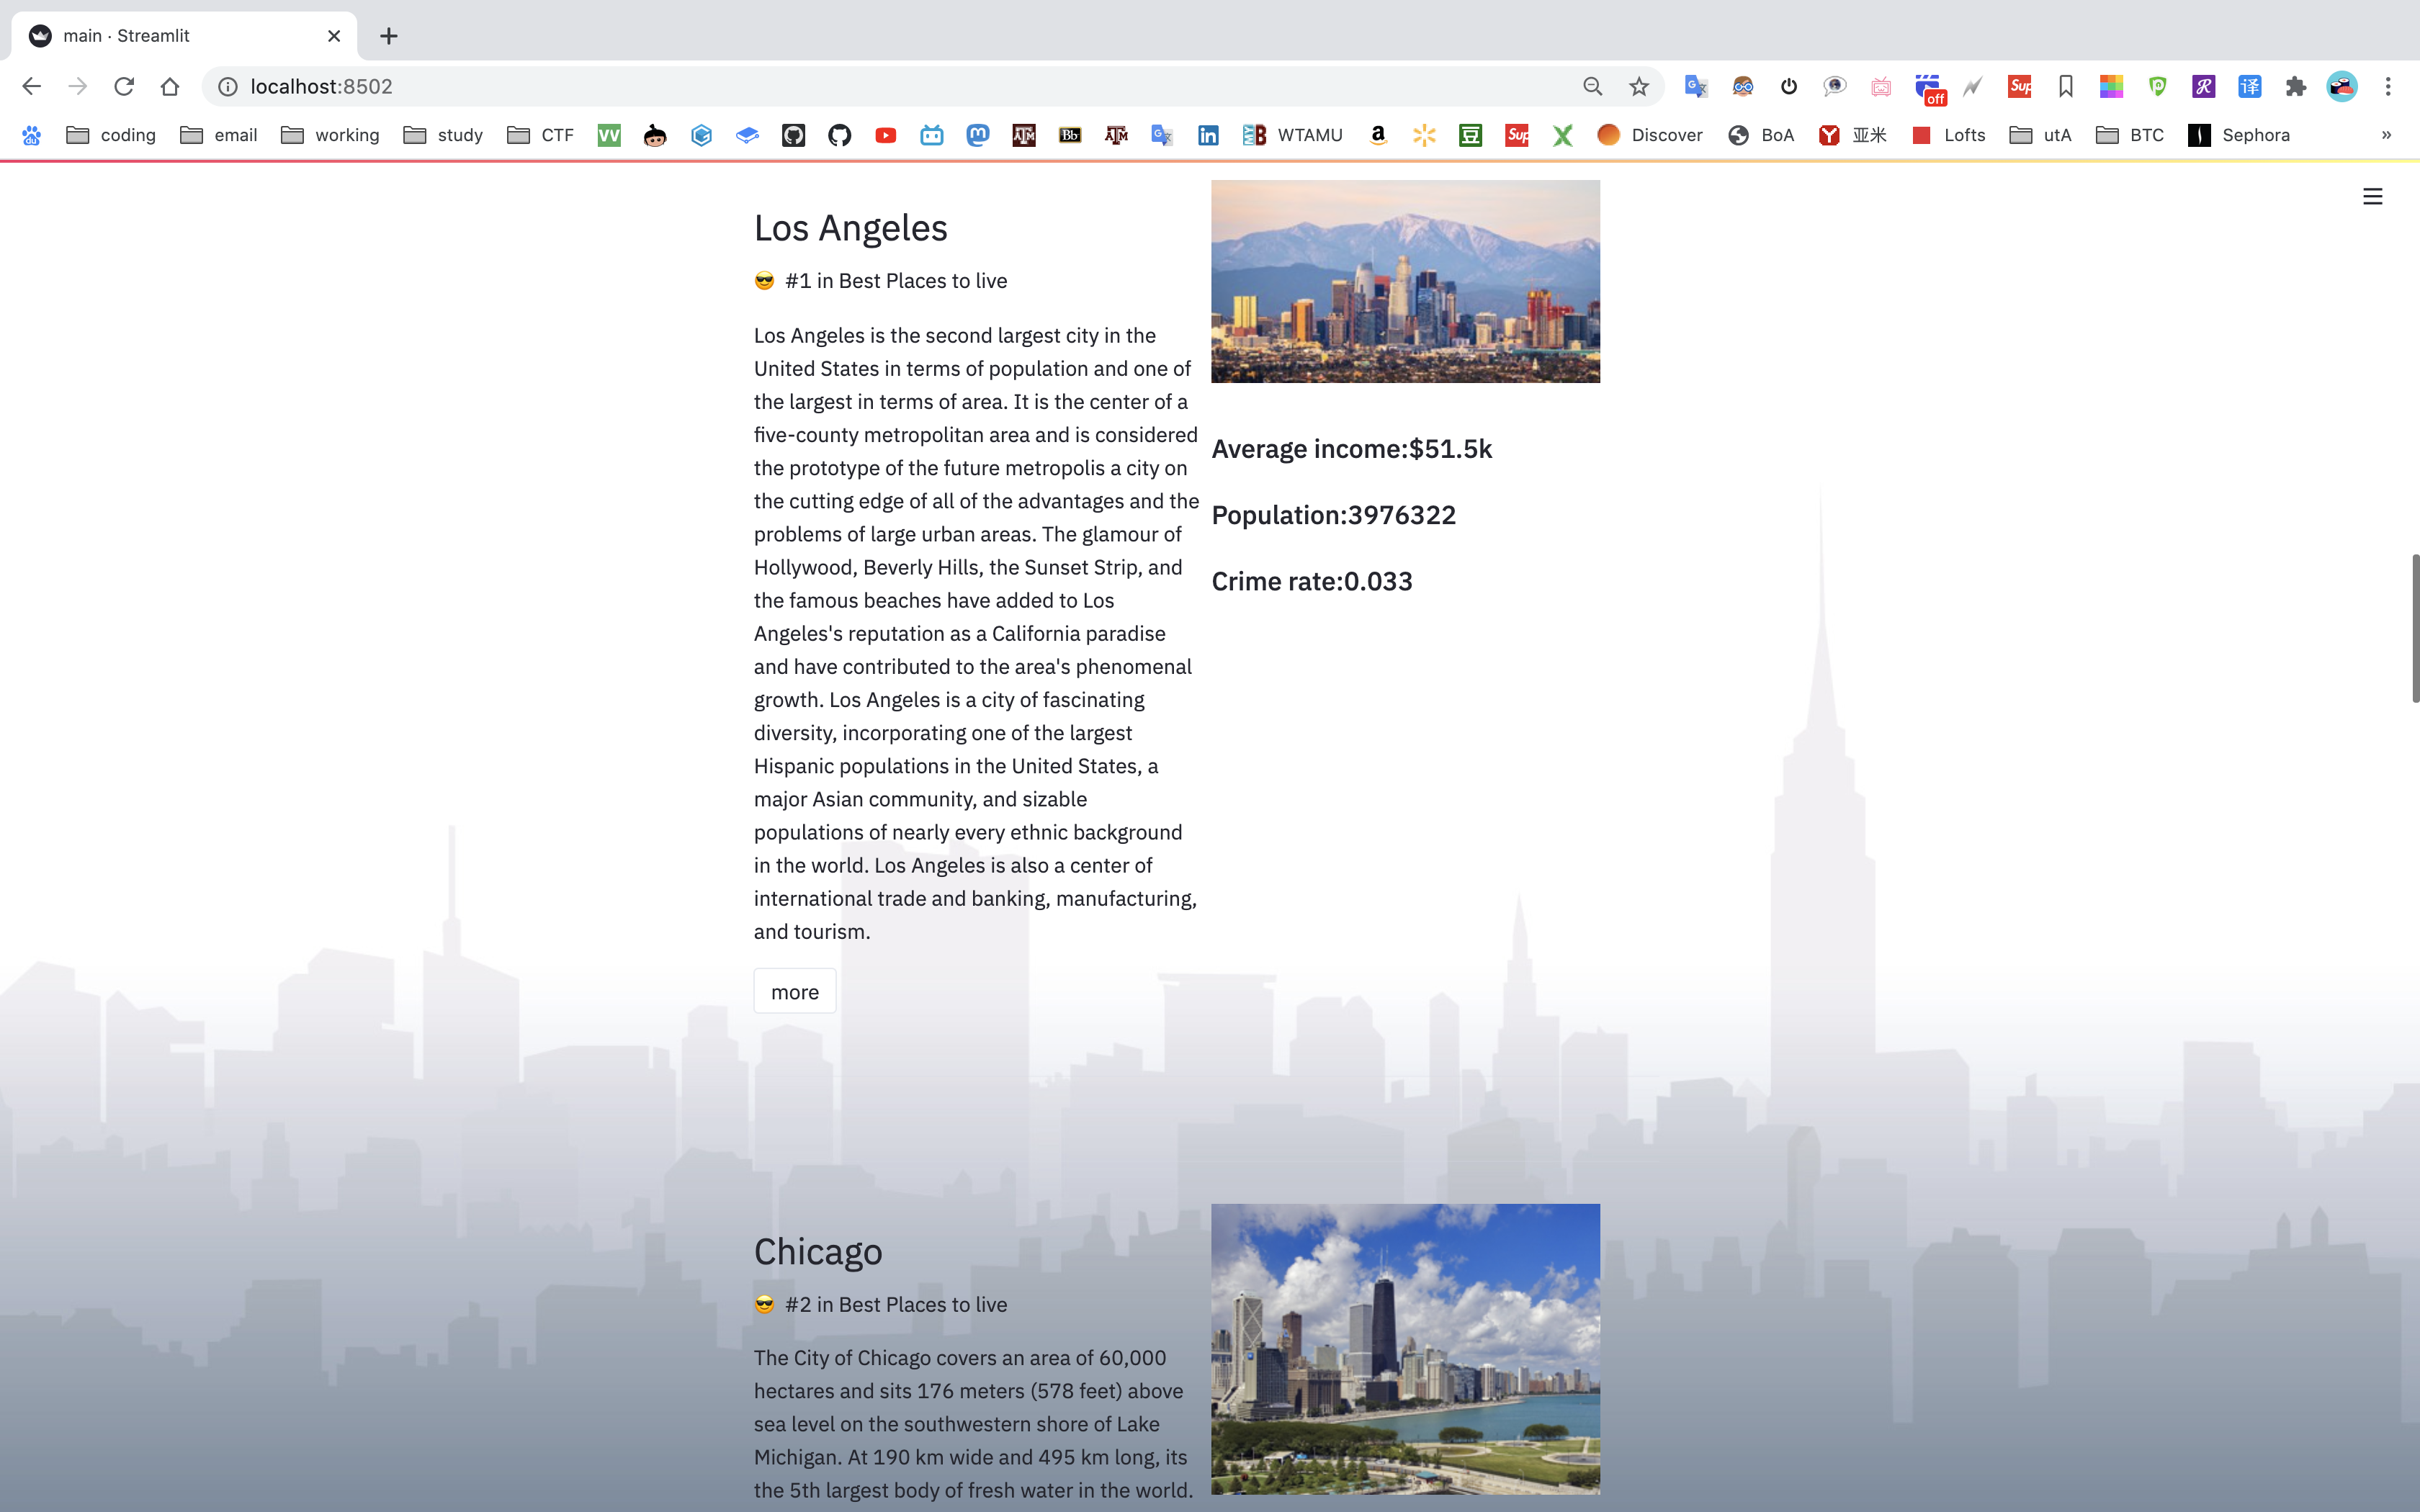
we have a card for each city, and a link to the wiki search
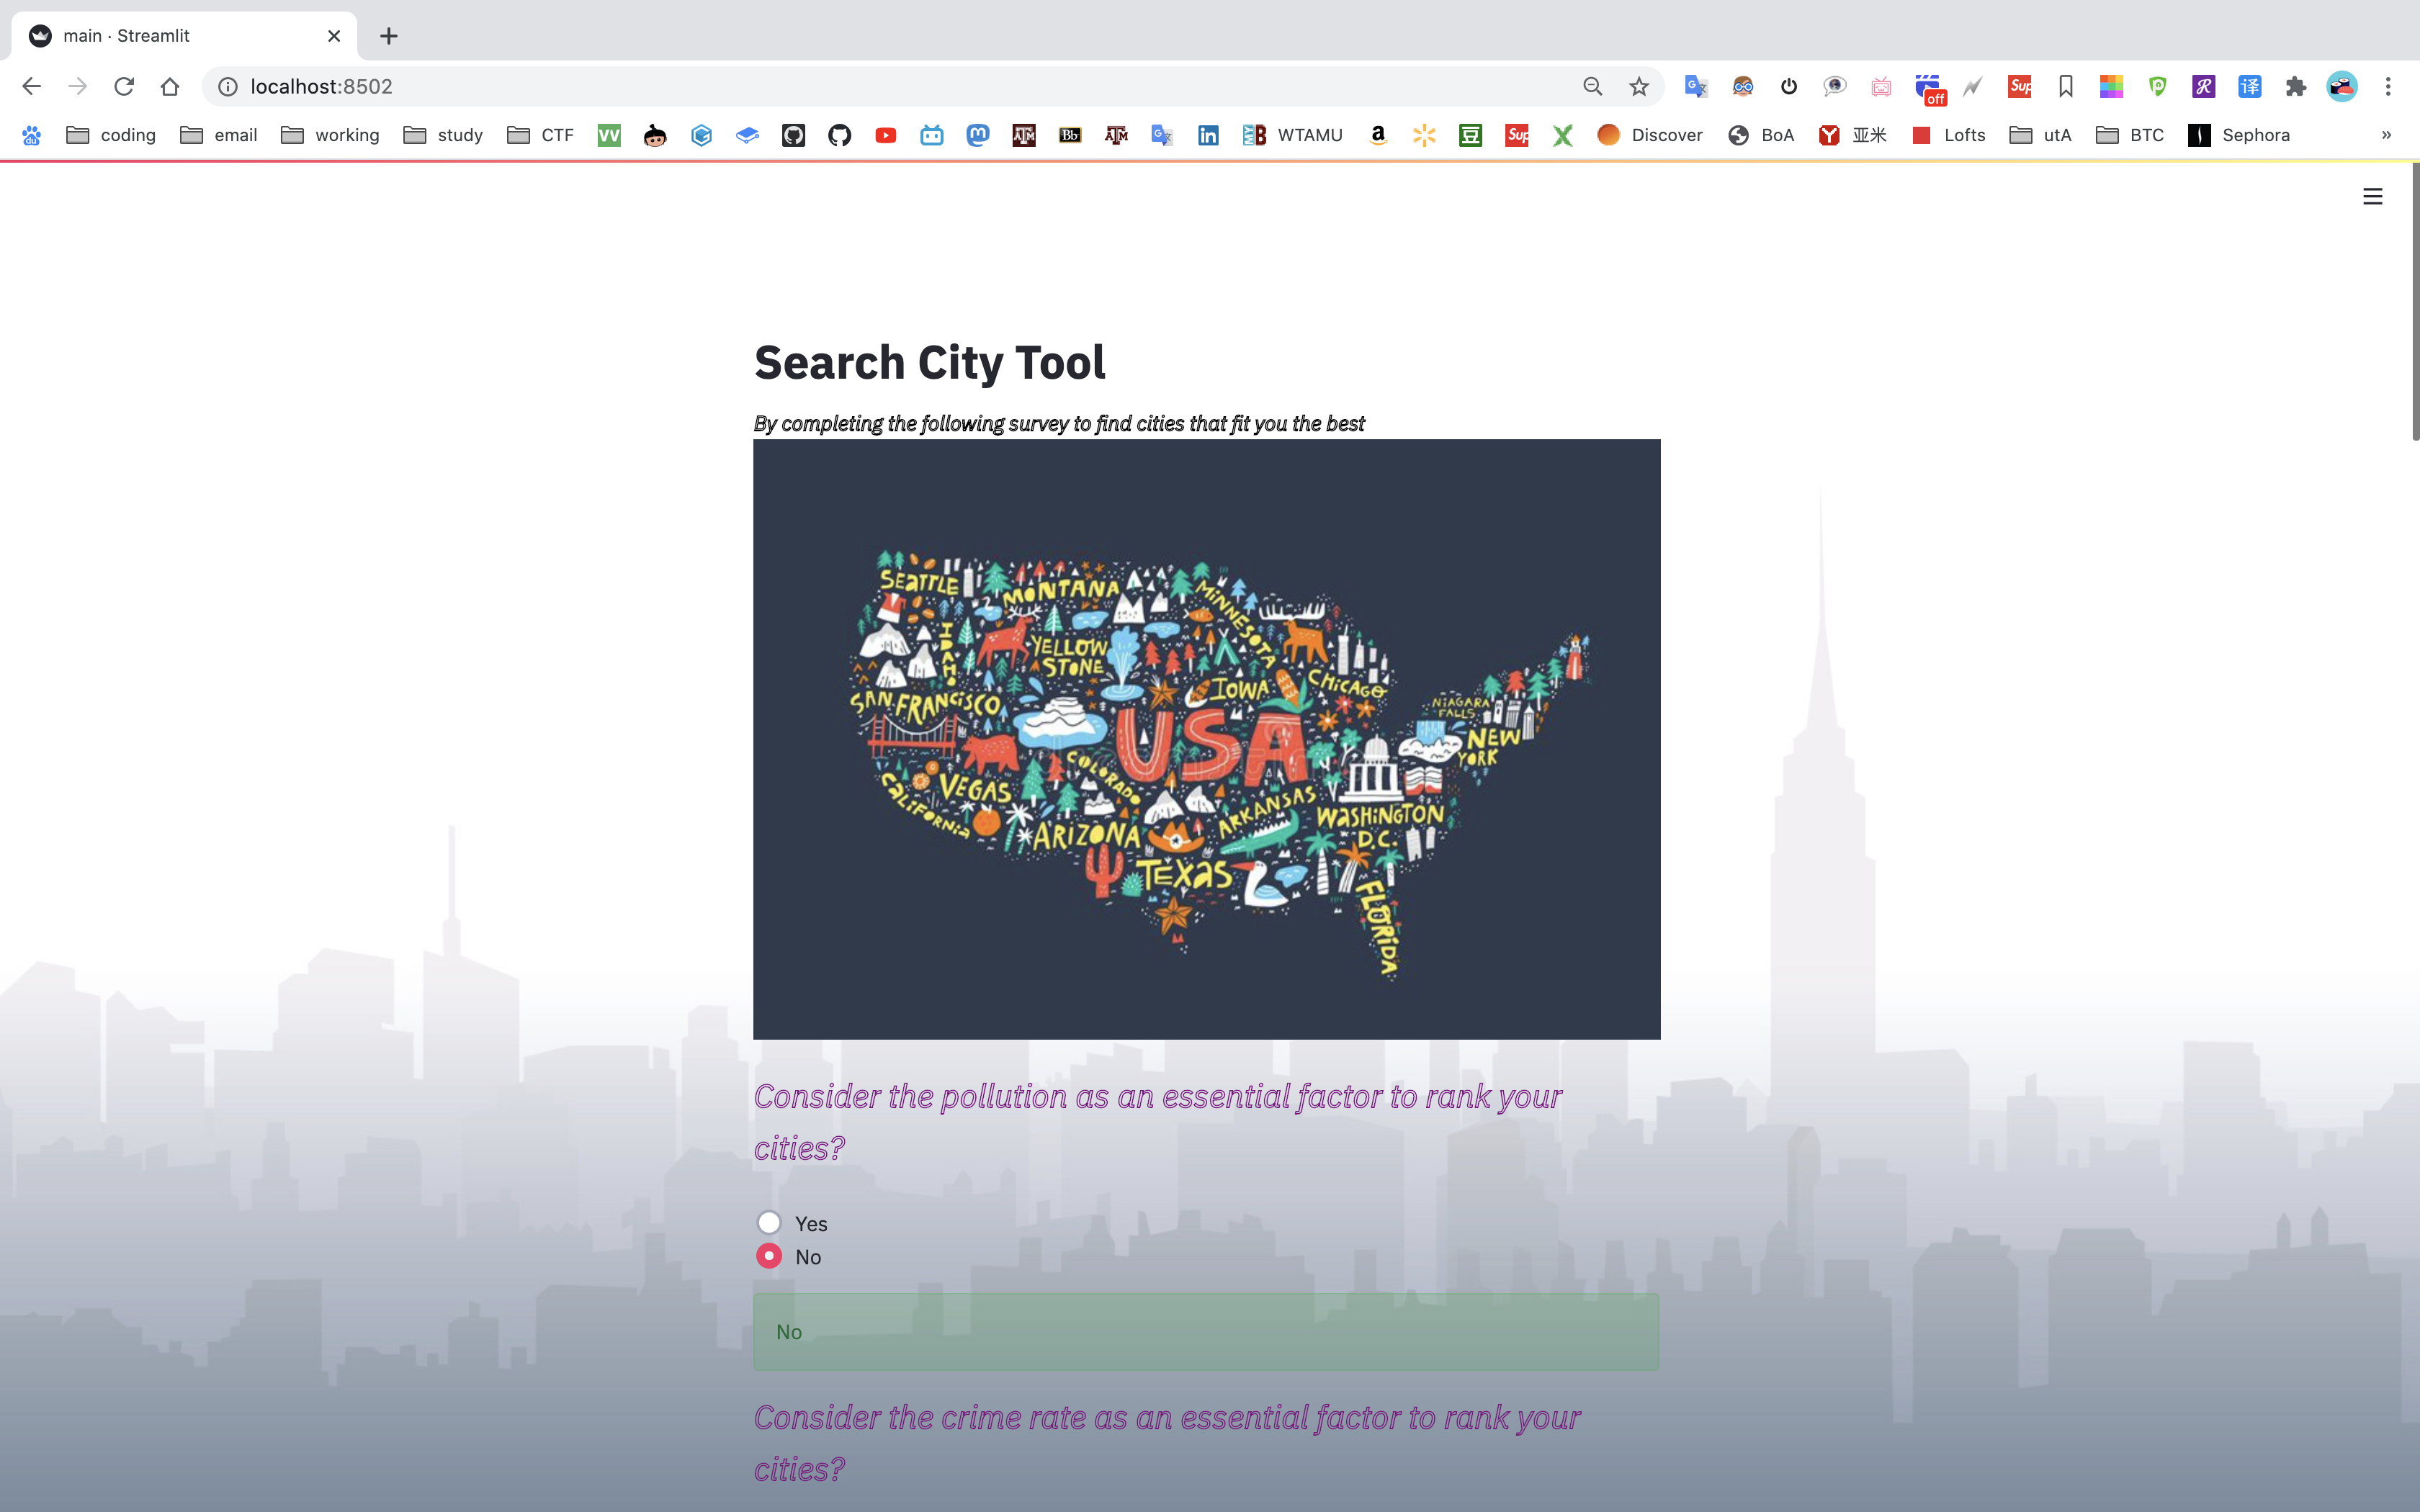
Inspiration
We were inspired by the worldwide city ranking and wanted to provide people with the characteristics of major cities in the United States. We are committed to choosing the city based on one's inclination through a variety of constraints (Different people's hearts yearn for the holy land is different!) The design of our project was inspired by websites like US News Ranking and we spare no efforts to make our project more unique.
What it does
The goal of our project is to provide customers with the most preferred places to live in major cities in the range of the United States. According to the different selection variables of customers, the most favorite holy land is finally obtained.
How we built it
Through the selection and analysis of massive data, we try to assign different weights to different selection variables. Finally, we visualize the customers' choices such as cities with small population density and high air quality through the web app.
Challenges we ran into
Since some members of the team are not computer science or statistics major, we have encountered many problems in processing data and building web pages such as the acquisition of table data, grabbing the useful information on the official web page, etc. But after learning online courses, we began to have the ability to obtain and analyze data in large quantities and learned how to use Streamlit to build web apps to realize data visualization.
Accomplishments that we're proud of
We managed to create a web application using Streamlit library, which none of us had any experience in.
How to use our application
Clone the repositories through the Github link, install the Streamlit enviornment, then use the command "streamlit run main.py"in the terminal to run the program. You will get an access to the our website link.


Log in or sign up for Devpost to join the conversation.