Restaurant_User_Rating_Analysis_Report
Dataset Link: https://www.kaggle.com/datasets/uciml/restaurant-data-with-consumer-ratings
Ask:
What significant features of a restaurant affect user's experience, in what way they affect them, what are user's interests and preferences, and understanding them to improve or change business processes in restaurants.
Goal: Analyse and prepare a visual report on features affecting restaurant's ratings.
Prepare:
Dataset from Kaggle as mentioned was collected (which was originally downloaded from the UCI ML Repository), checked to ensure that data used in unbiased and secure. This dataset contained information on restaurants, users, and user-ratings.
Clean:
PowerBI was used to import all the data (as csv), and data was cleaned using the transform data feature in PowerBI. Cleaning included dealing with missing data (removing observations/filling them with avg values), removing duplicates, irrelevant attributes and renaming columns wherever needed.
Analyse:
Necessary relationships were added between the different tables in the database to understand the relations between them. Data was then analysed by using the filters, measures (functions, formulas).
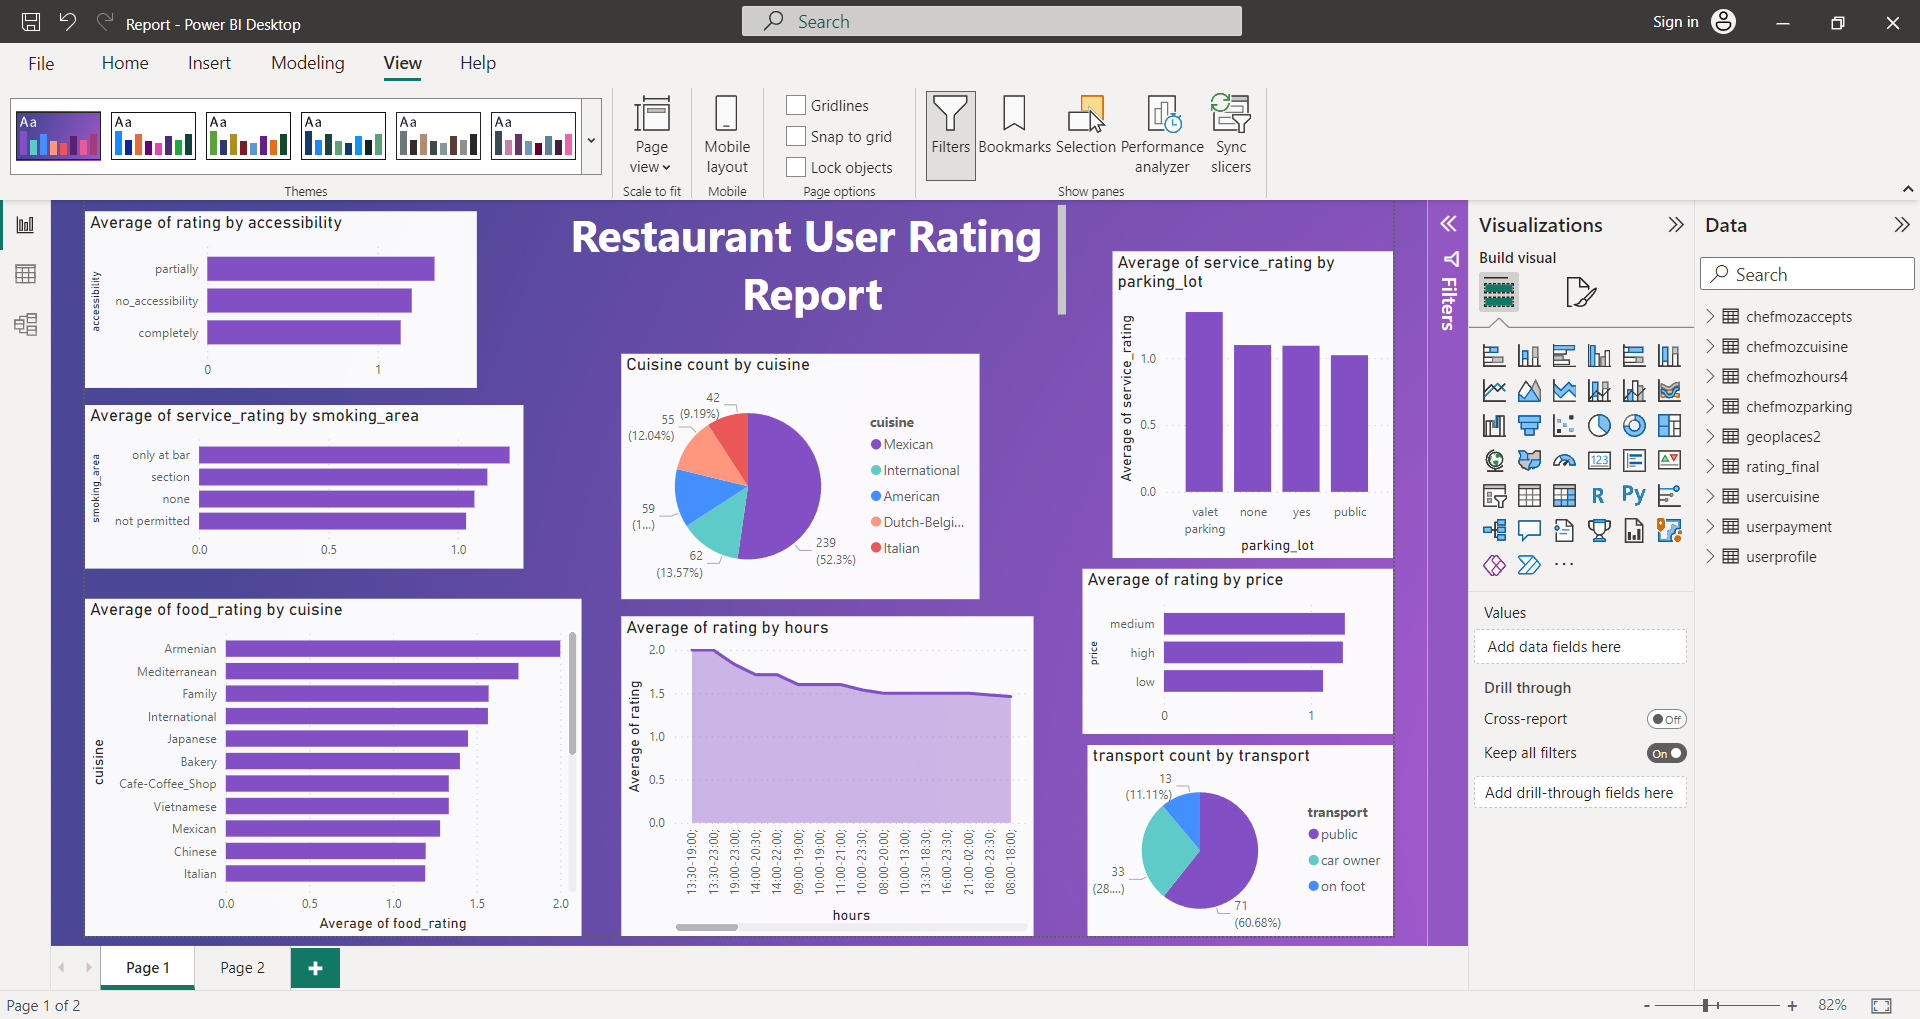
Share:
Insights generated were jotted and visual charts were prepared to share the insights.
Built With
- powerbi


Log in or sign up for Devpost to join the conversation.