-
-
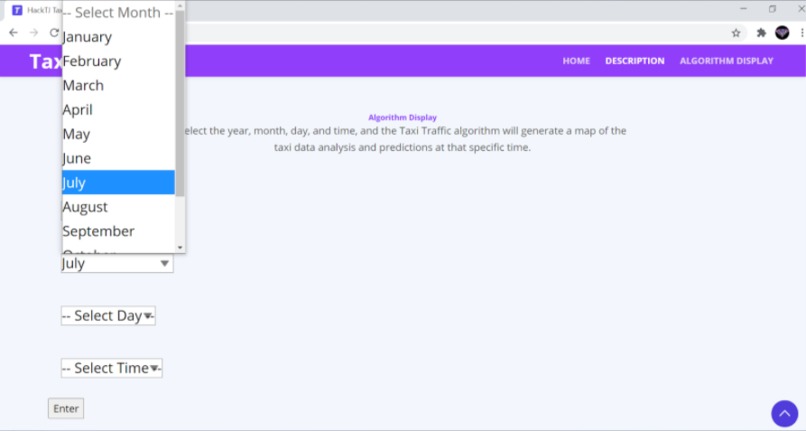
Web interface and input
-
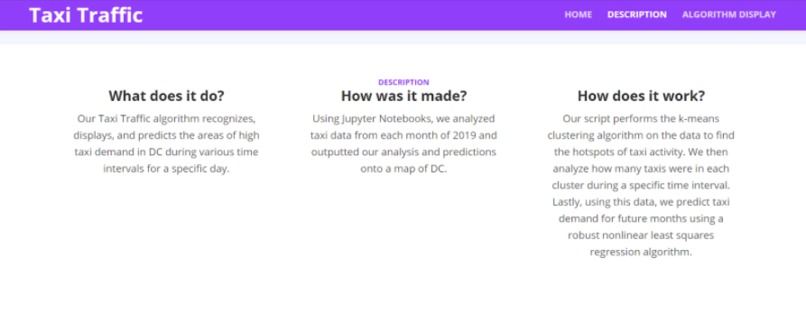
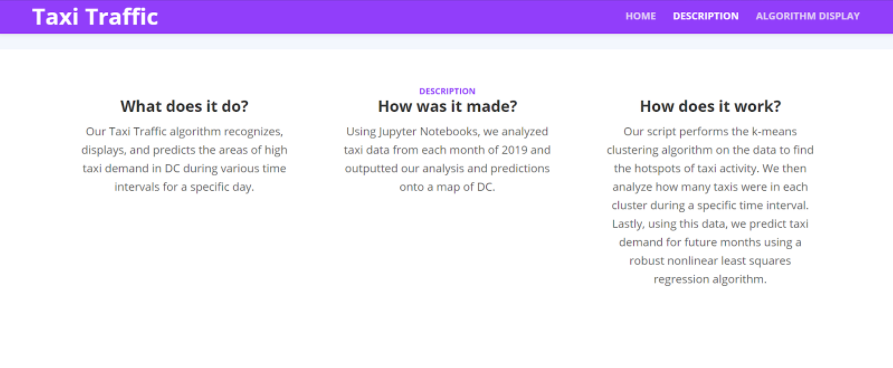
Website description
-
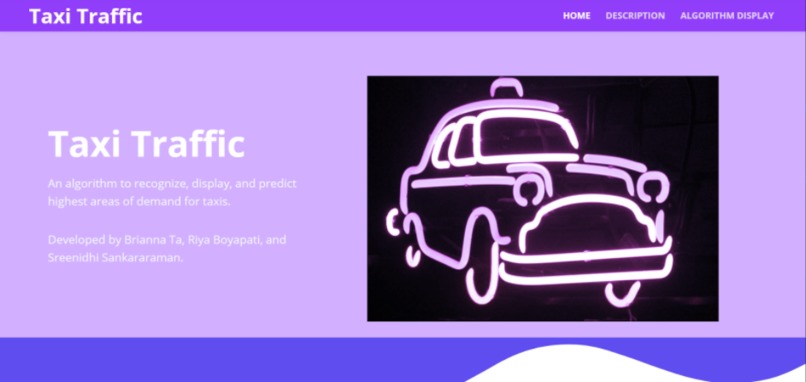
Website front page
-
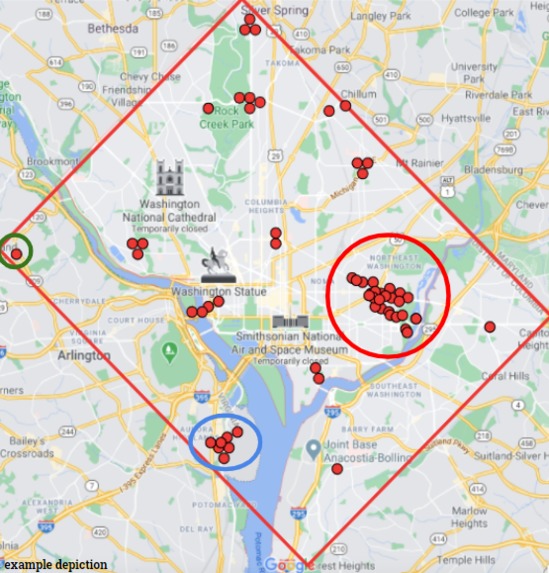
Example depiction of our map


Inspiration
We were inspired by the East Banc datasets and wanted to create an algorithm to reduce the waiting time for a taxi.
What it does
Our project analyzes 2019 Taxi data from East Banc Technologies, processing the data into dictionaries that we can analyze. Our algorithm clusters the geographic coordinates using the k-means algorithm and splits the times into 15 minute intervals. For each interval and cluster, we record the number of taxis in that area in a dictionary. We calculate the means of each cluster and put that into another dictionary. Both of these dictionaries are outputted into a text file that is processed by another script to predict the taxi demand for future dates using a robust nonlinear regression algorithm. The analyzed and predicted data is processed and plotted on a map on our web interface.
How we built it
We built our algorithm in three Google Colab Jupyter notebooks and used HTML and CSS for our website.
Challenges we ran into
We ran into challenges with processing the data since there were 12 CSV files for each month of 2019 and each file had over 500,000 rows of data. Additionally, we were unfamiliar with the many python libraries that proved helpful for our project.
Accomplishments that we're proud of
We are proud of creating this project and finishing our algorithms and website.
What we learned
We learned how to make a website using HTML, CSS, and Bootstrap. We were able to grasp how to use the pandas, numpy, and scipy libraries through this project. Lastly, we picked up how to use the many facets of Google Colab.
What's next for Taxi Traffic
In the future, we will look for more data so we can improve the accuracy of our prediction model as well as extending into other popular areas for taxis.


Log in or sign up for Devpost to join the conversation.