-
-
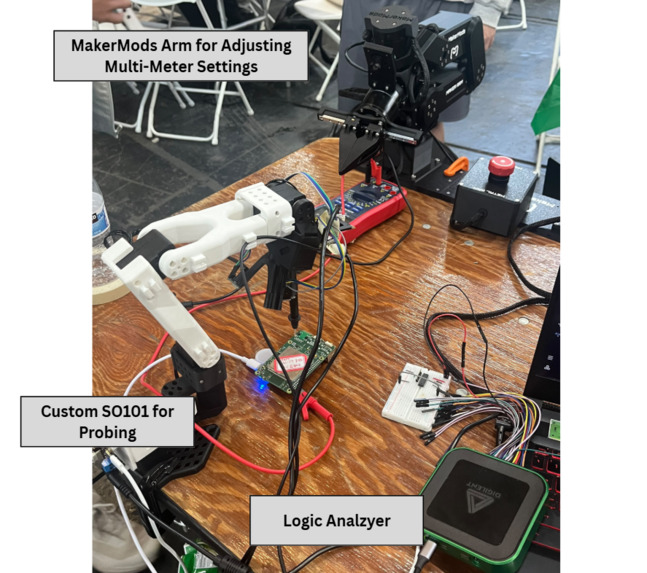
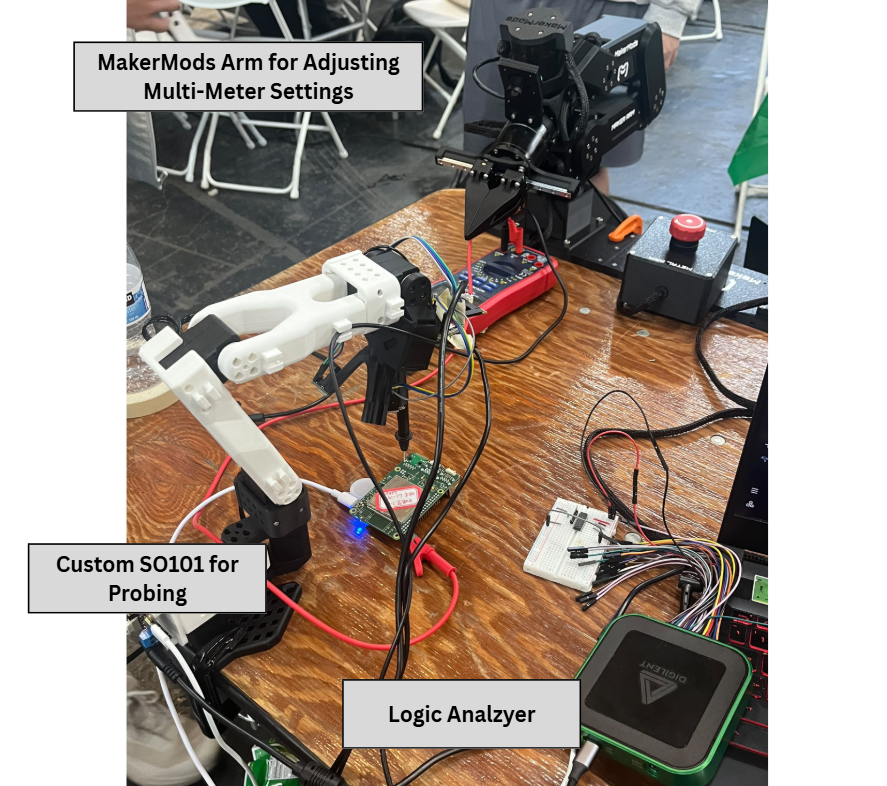
Physical Setup
-
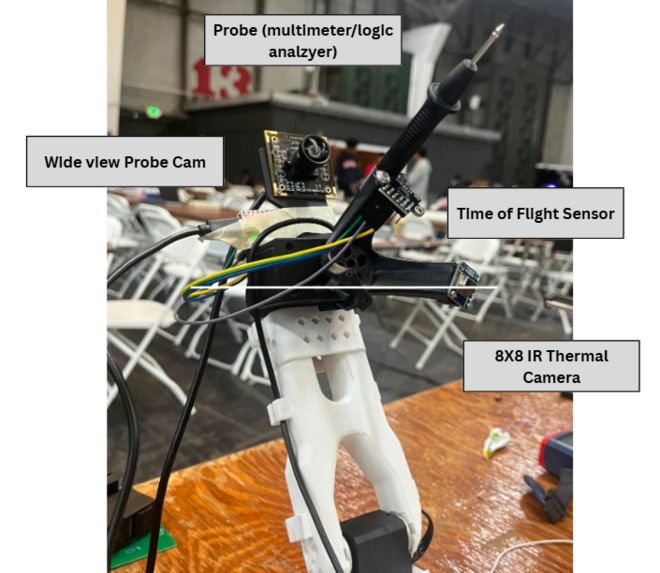
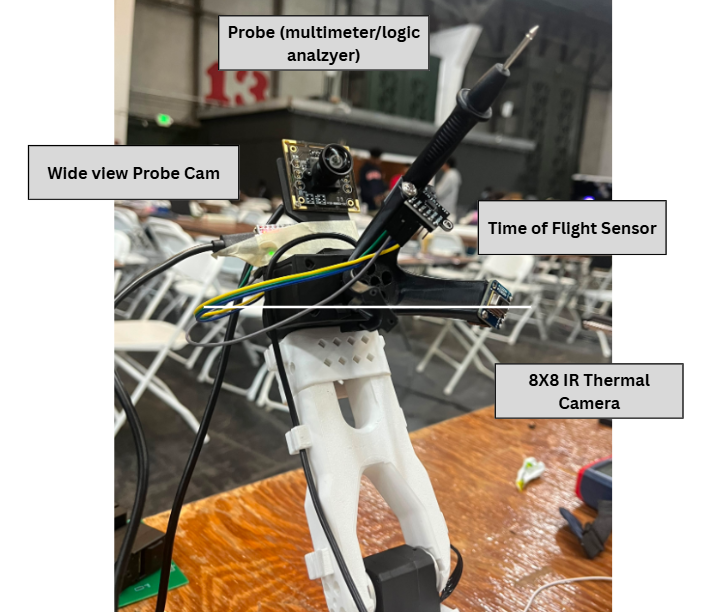
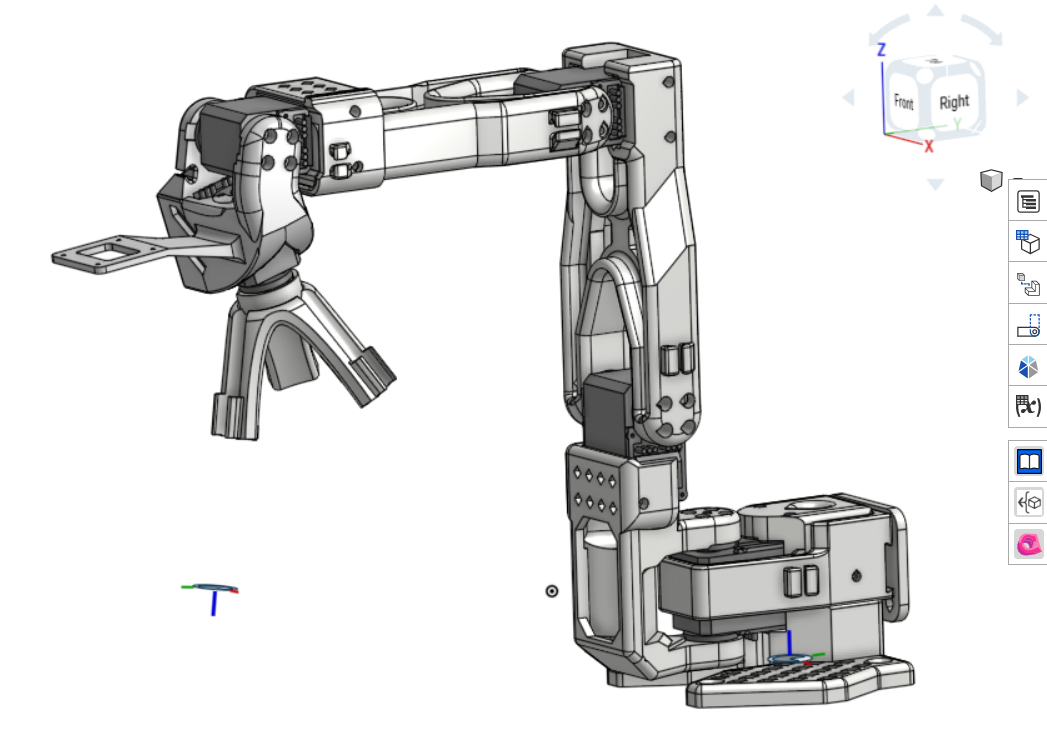
Custom End-effector Designed for SO101 arms
-
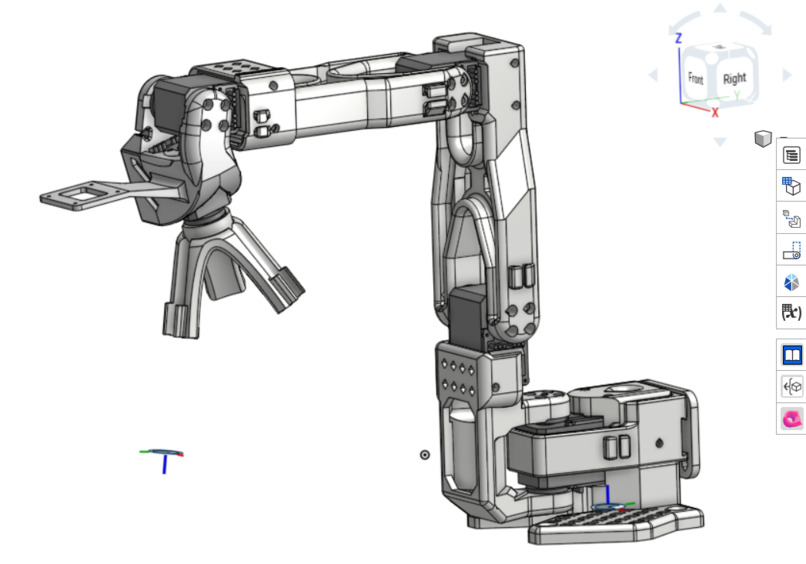
Onshape assembly of the arm with custom end-effector that can swap probes
-
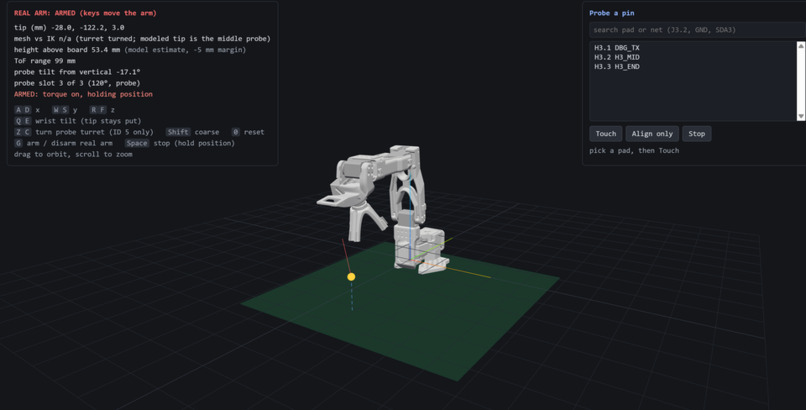
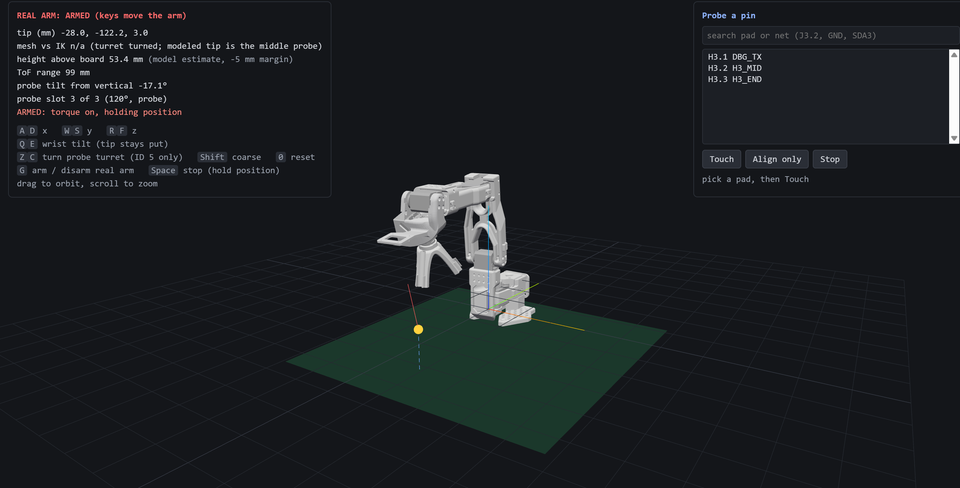
Digital Twin w/ Encoder inputs and IK output
-
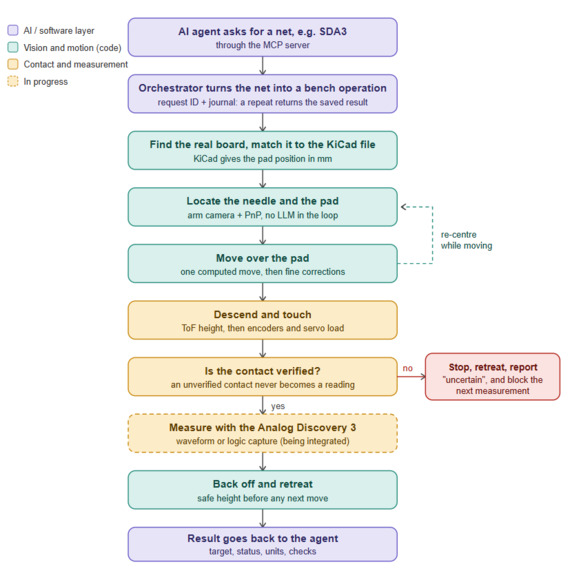
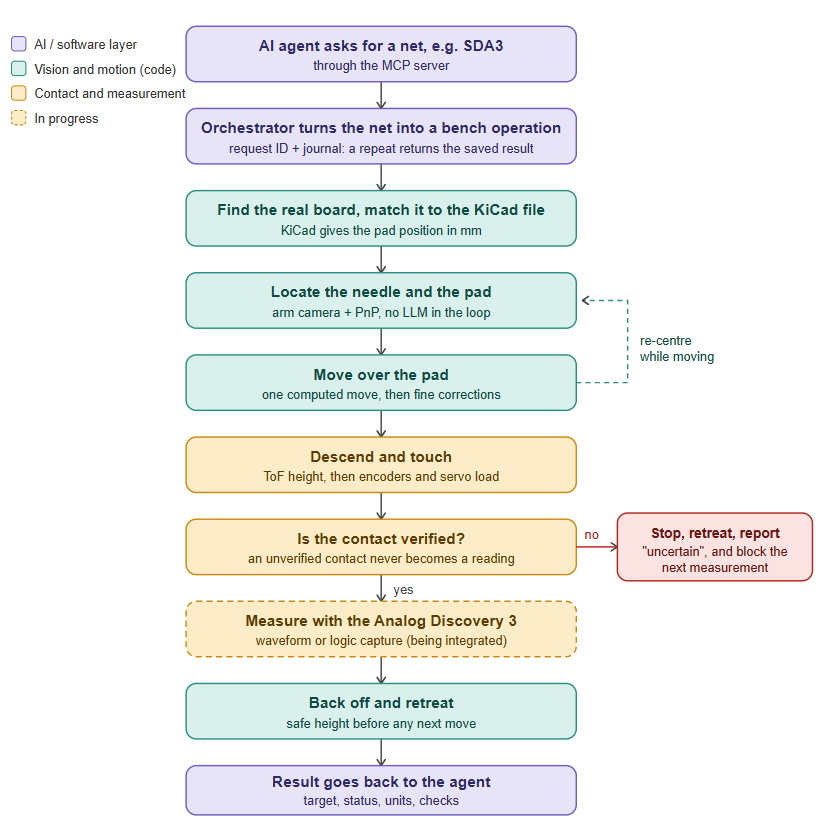
Abstracted Controls Pipeline
-
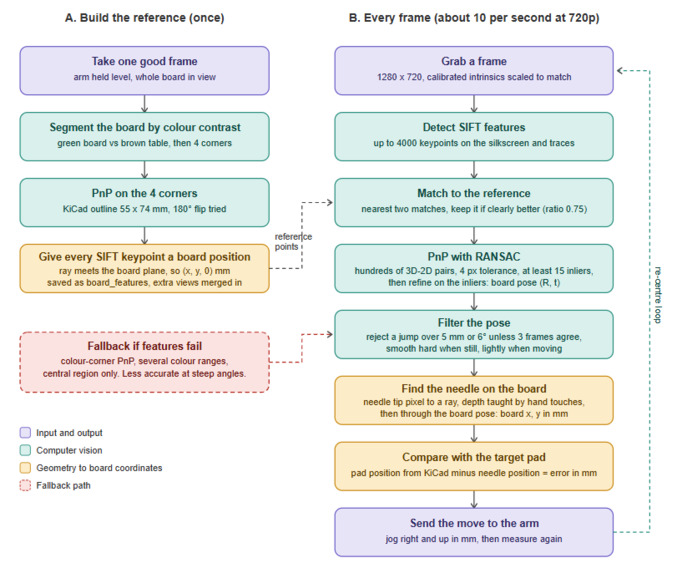
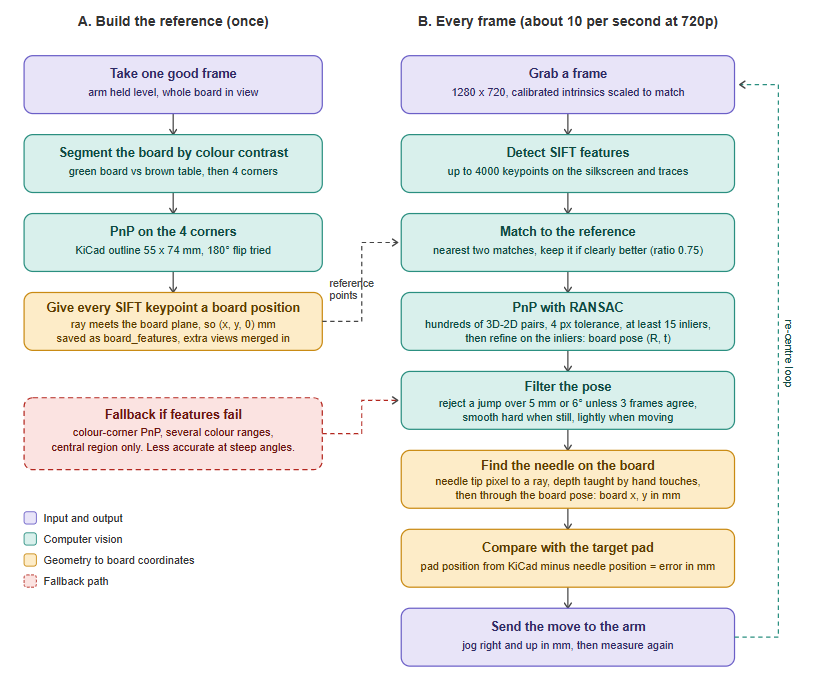
Detailed Pinout Tracking and Probe Alignment Pipeline
-
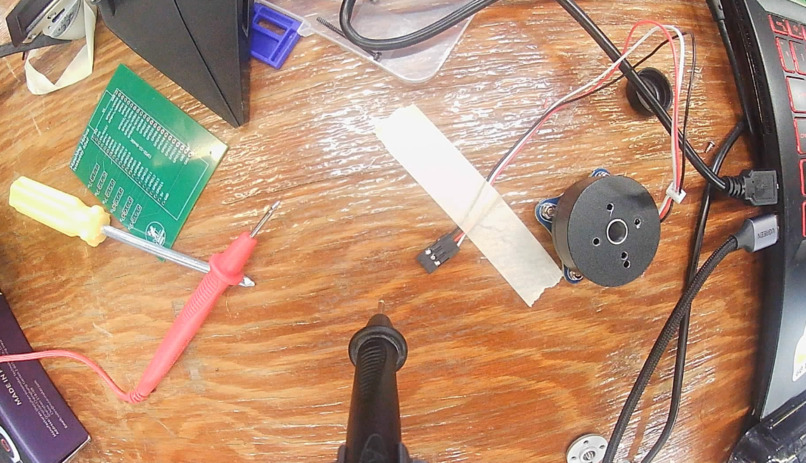
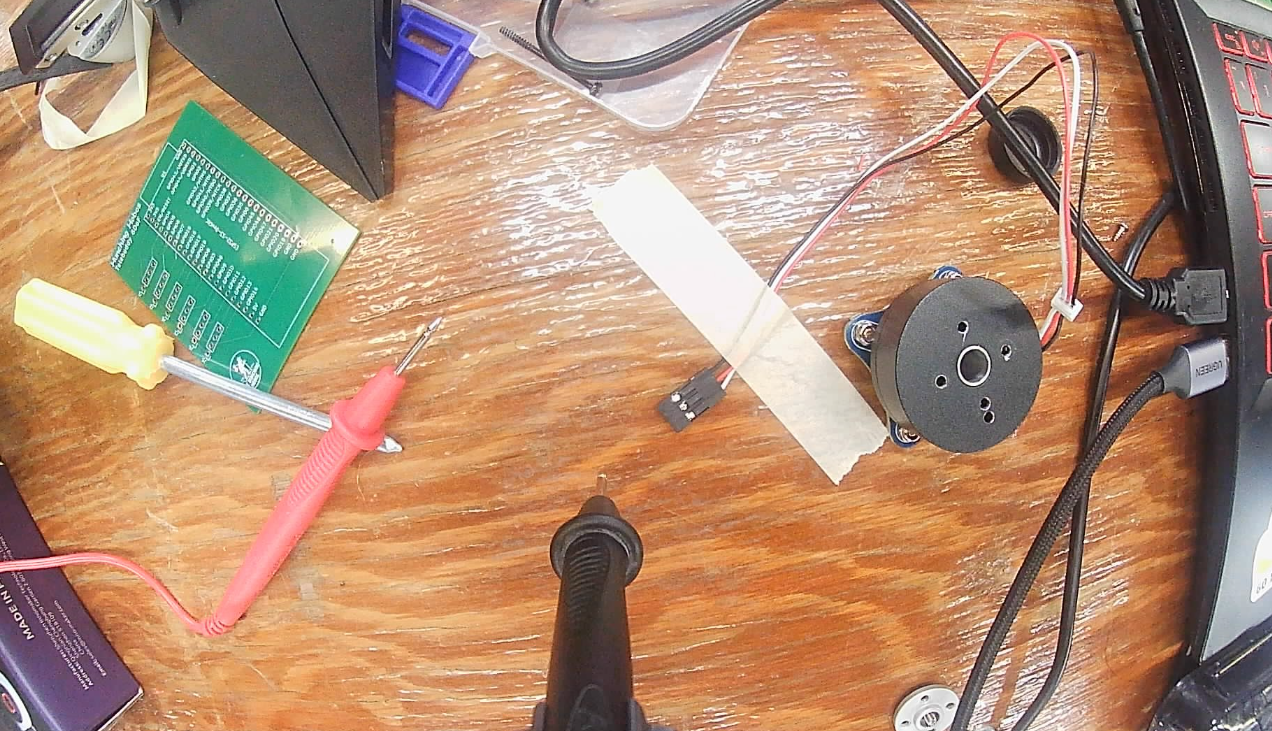
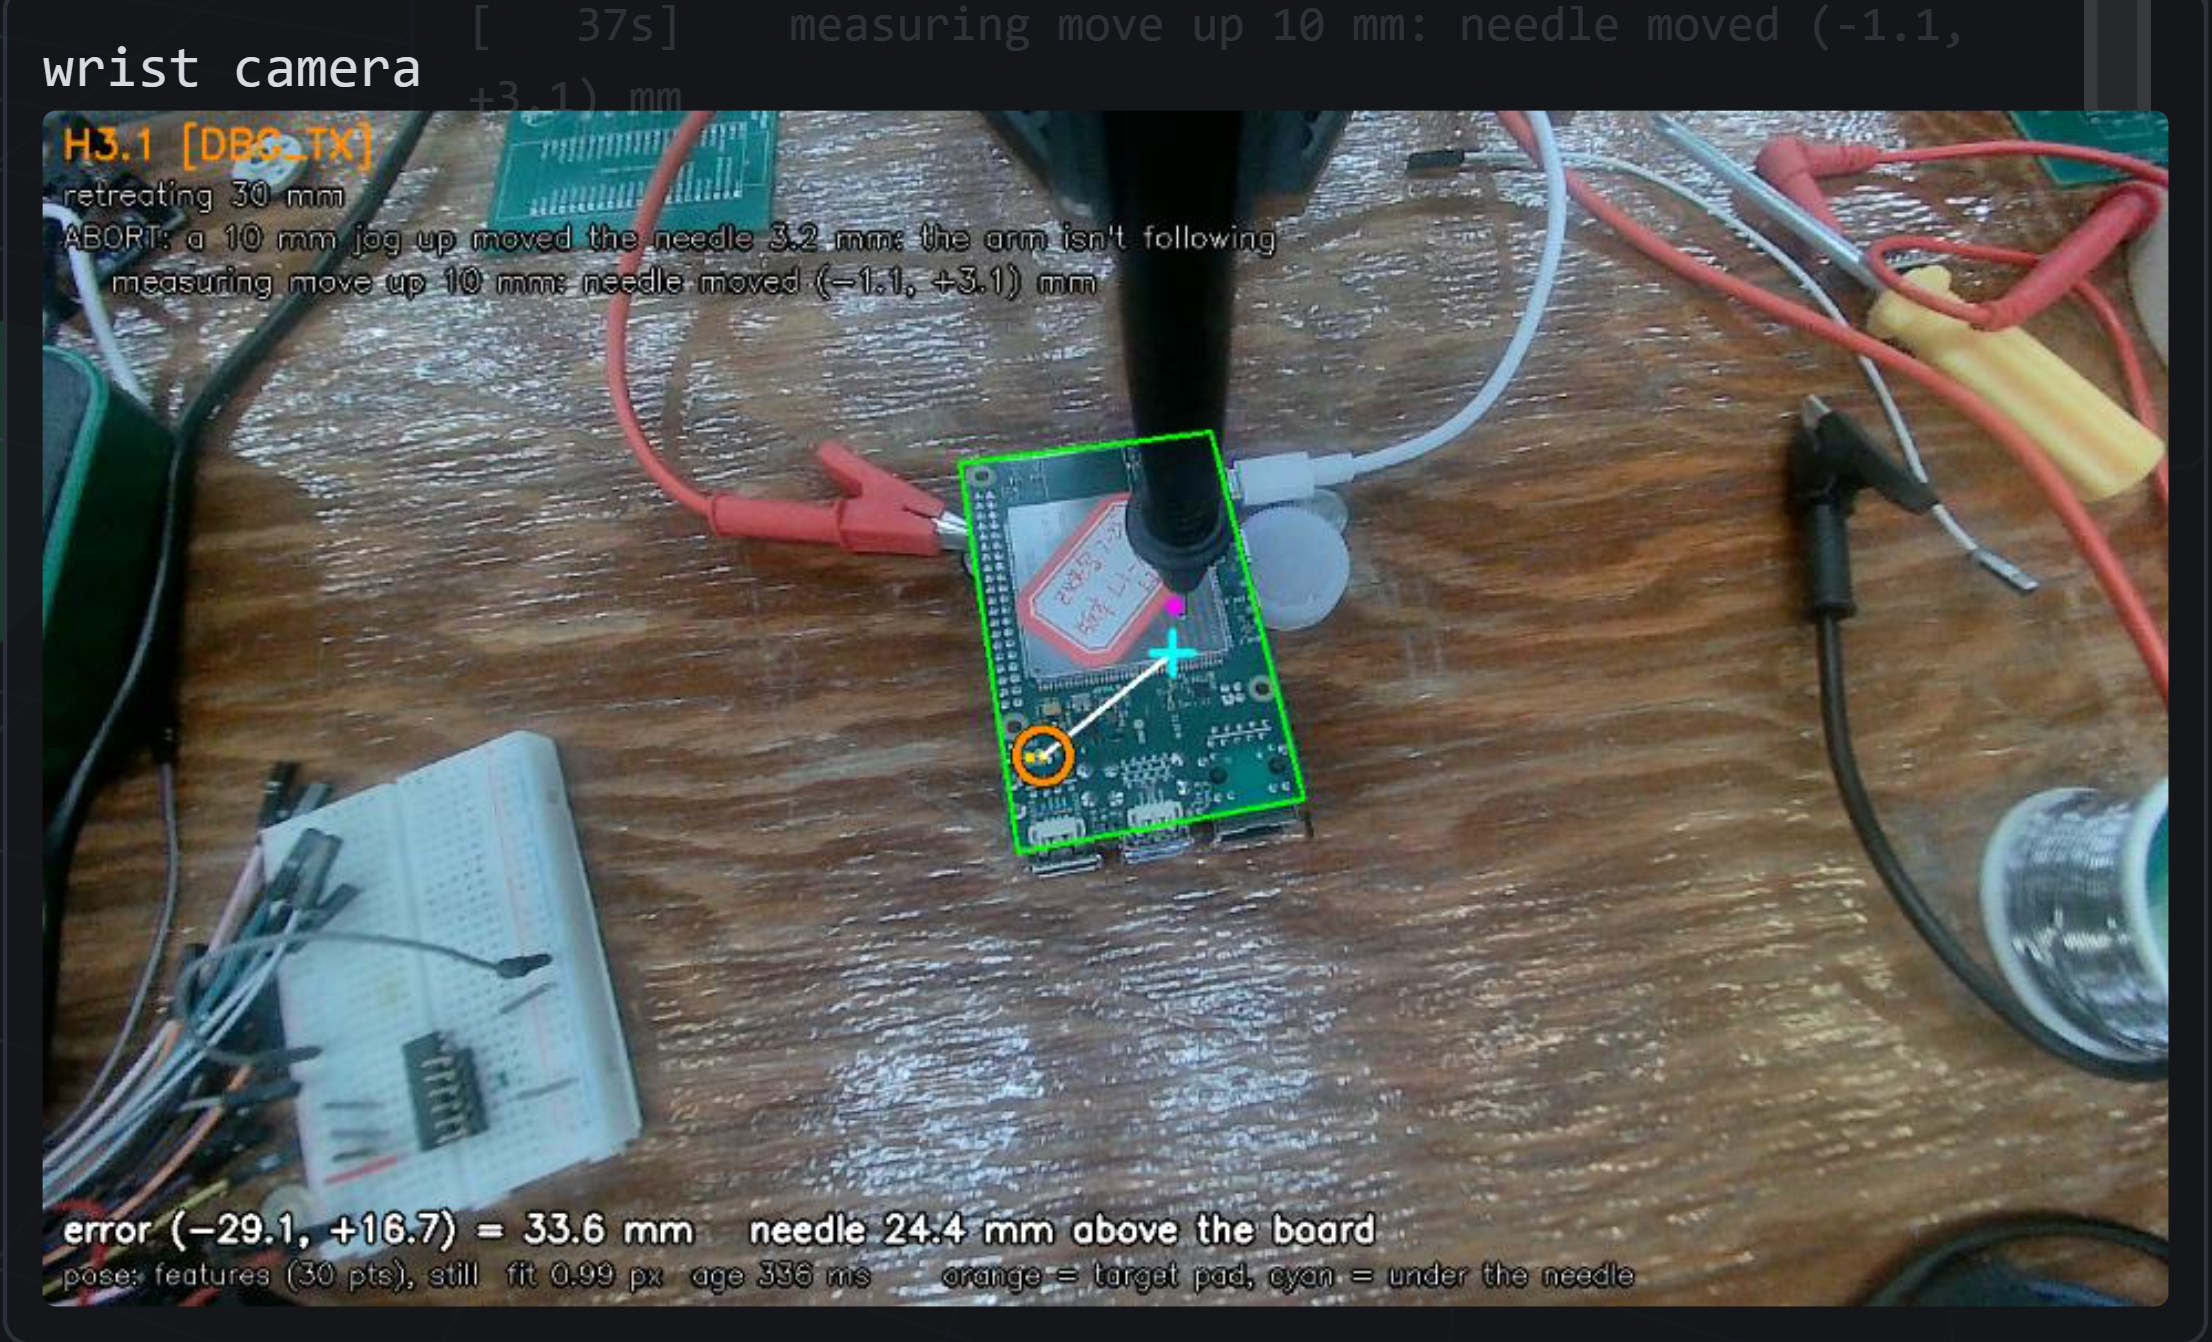
Sample input frame of the probe camera
-
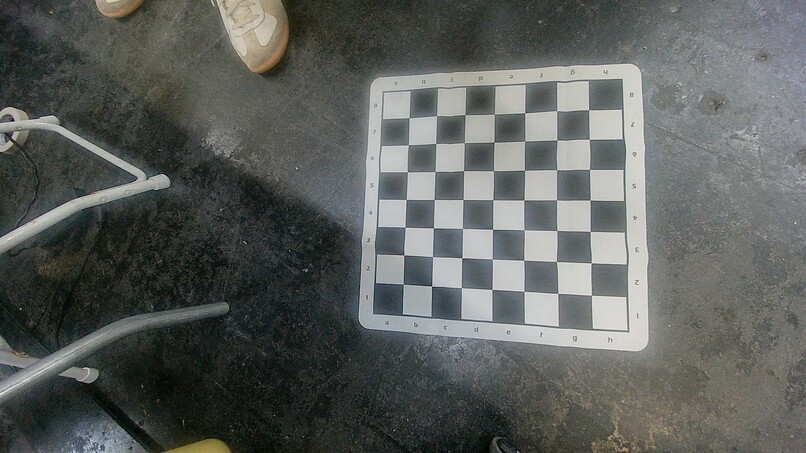
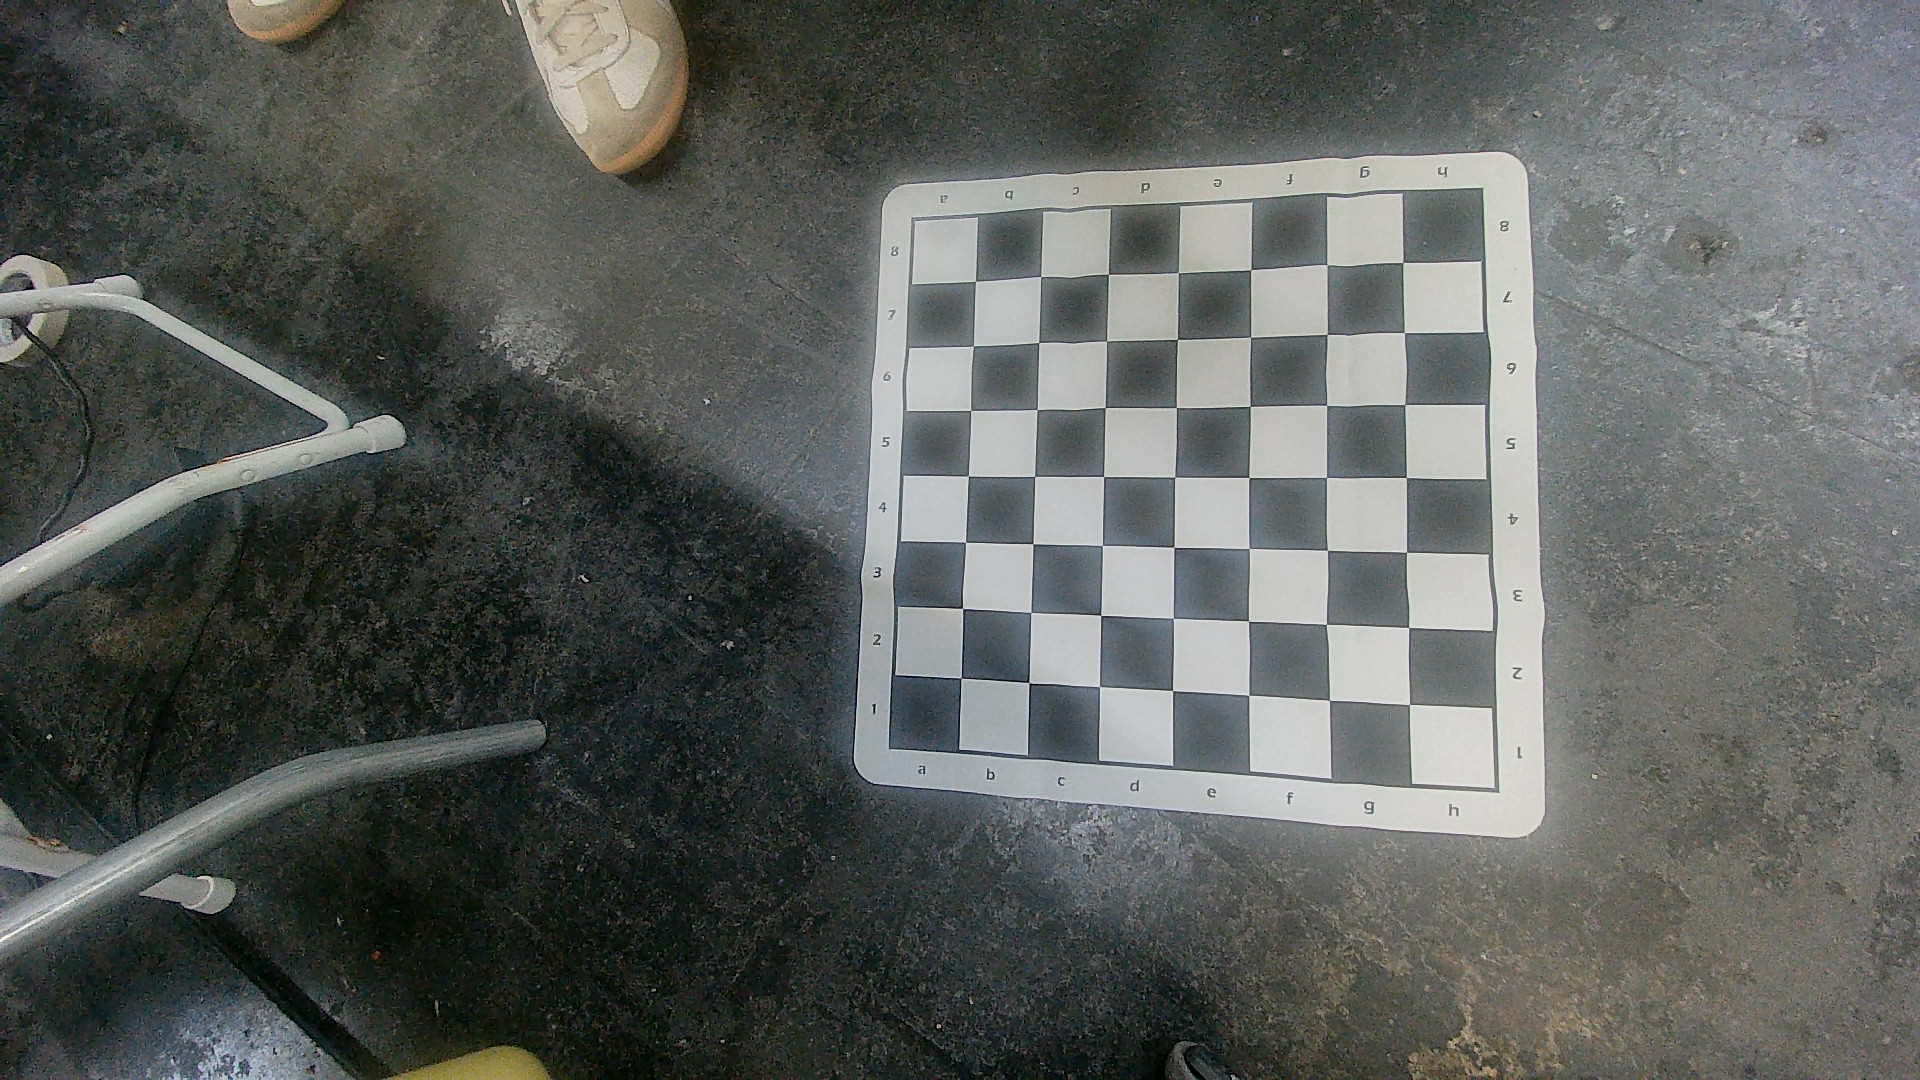
Determining the Instrinsic Calibration Matrix of our camera for PnP controls
-
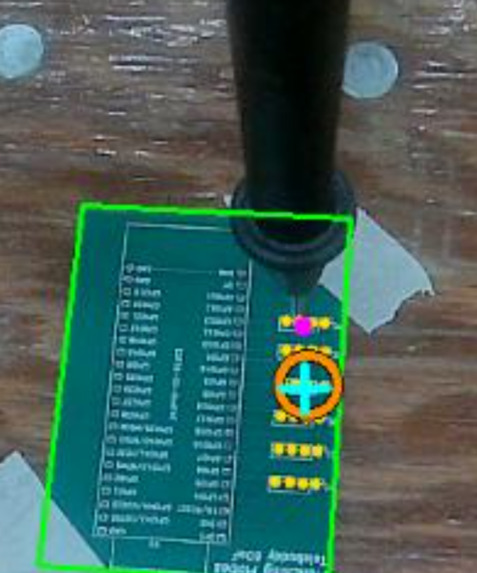
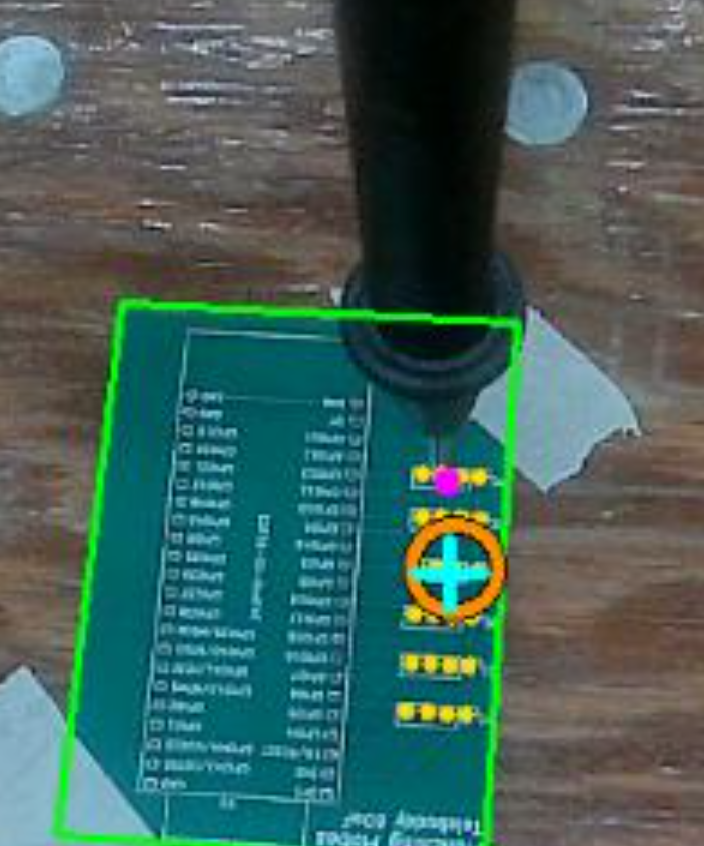
Precise probe matching (pink: probe position, cyan: projected probe position on PCB)
-
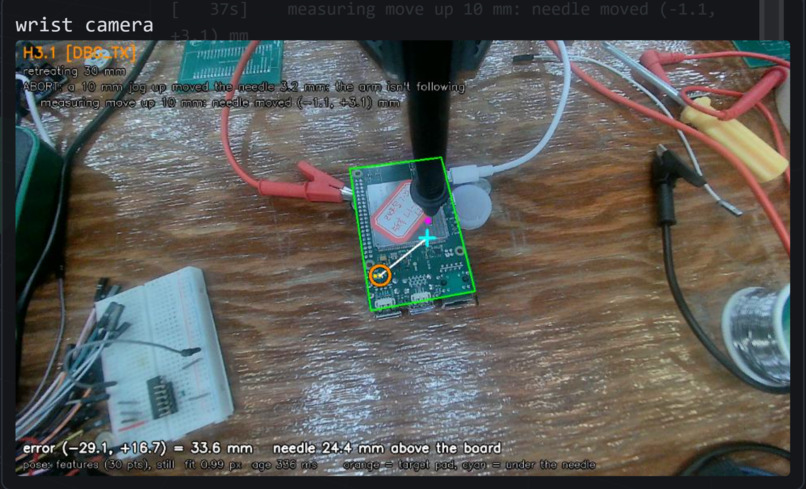
PnP sketmatic overlay / reference pin tracking
-
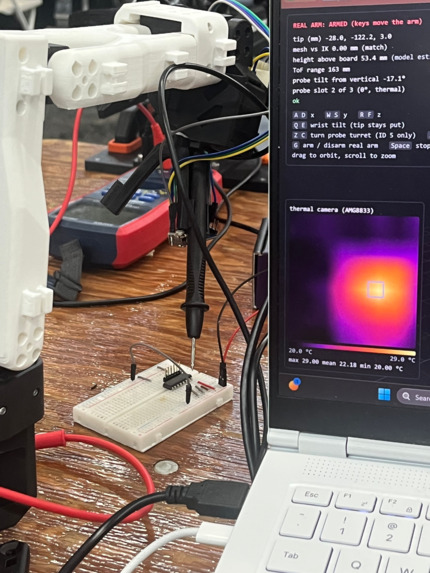
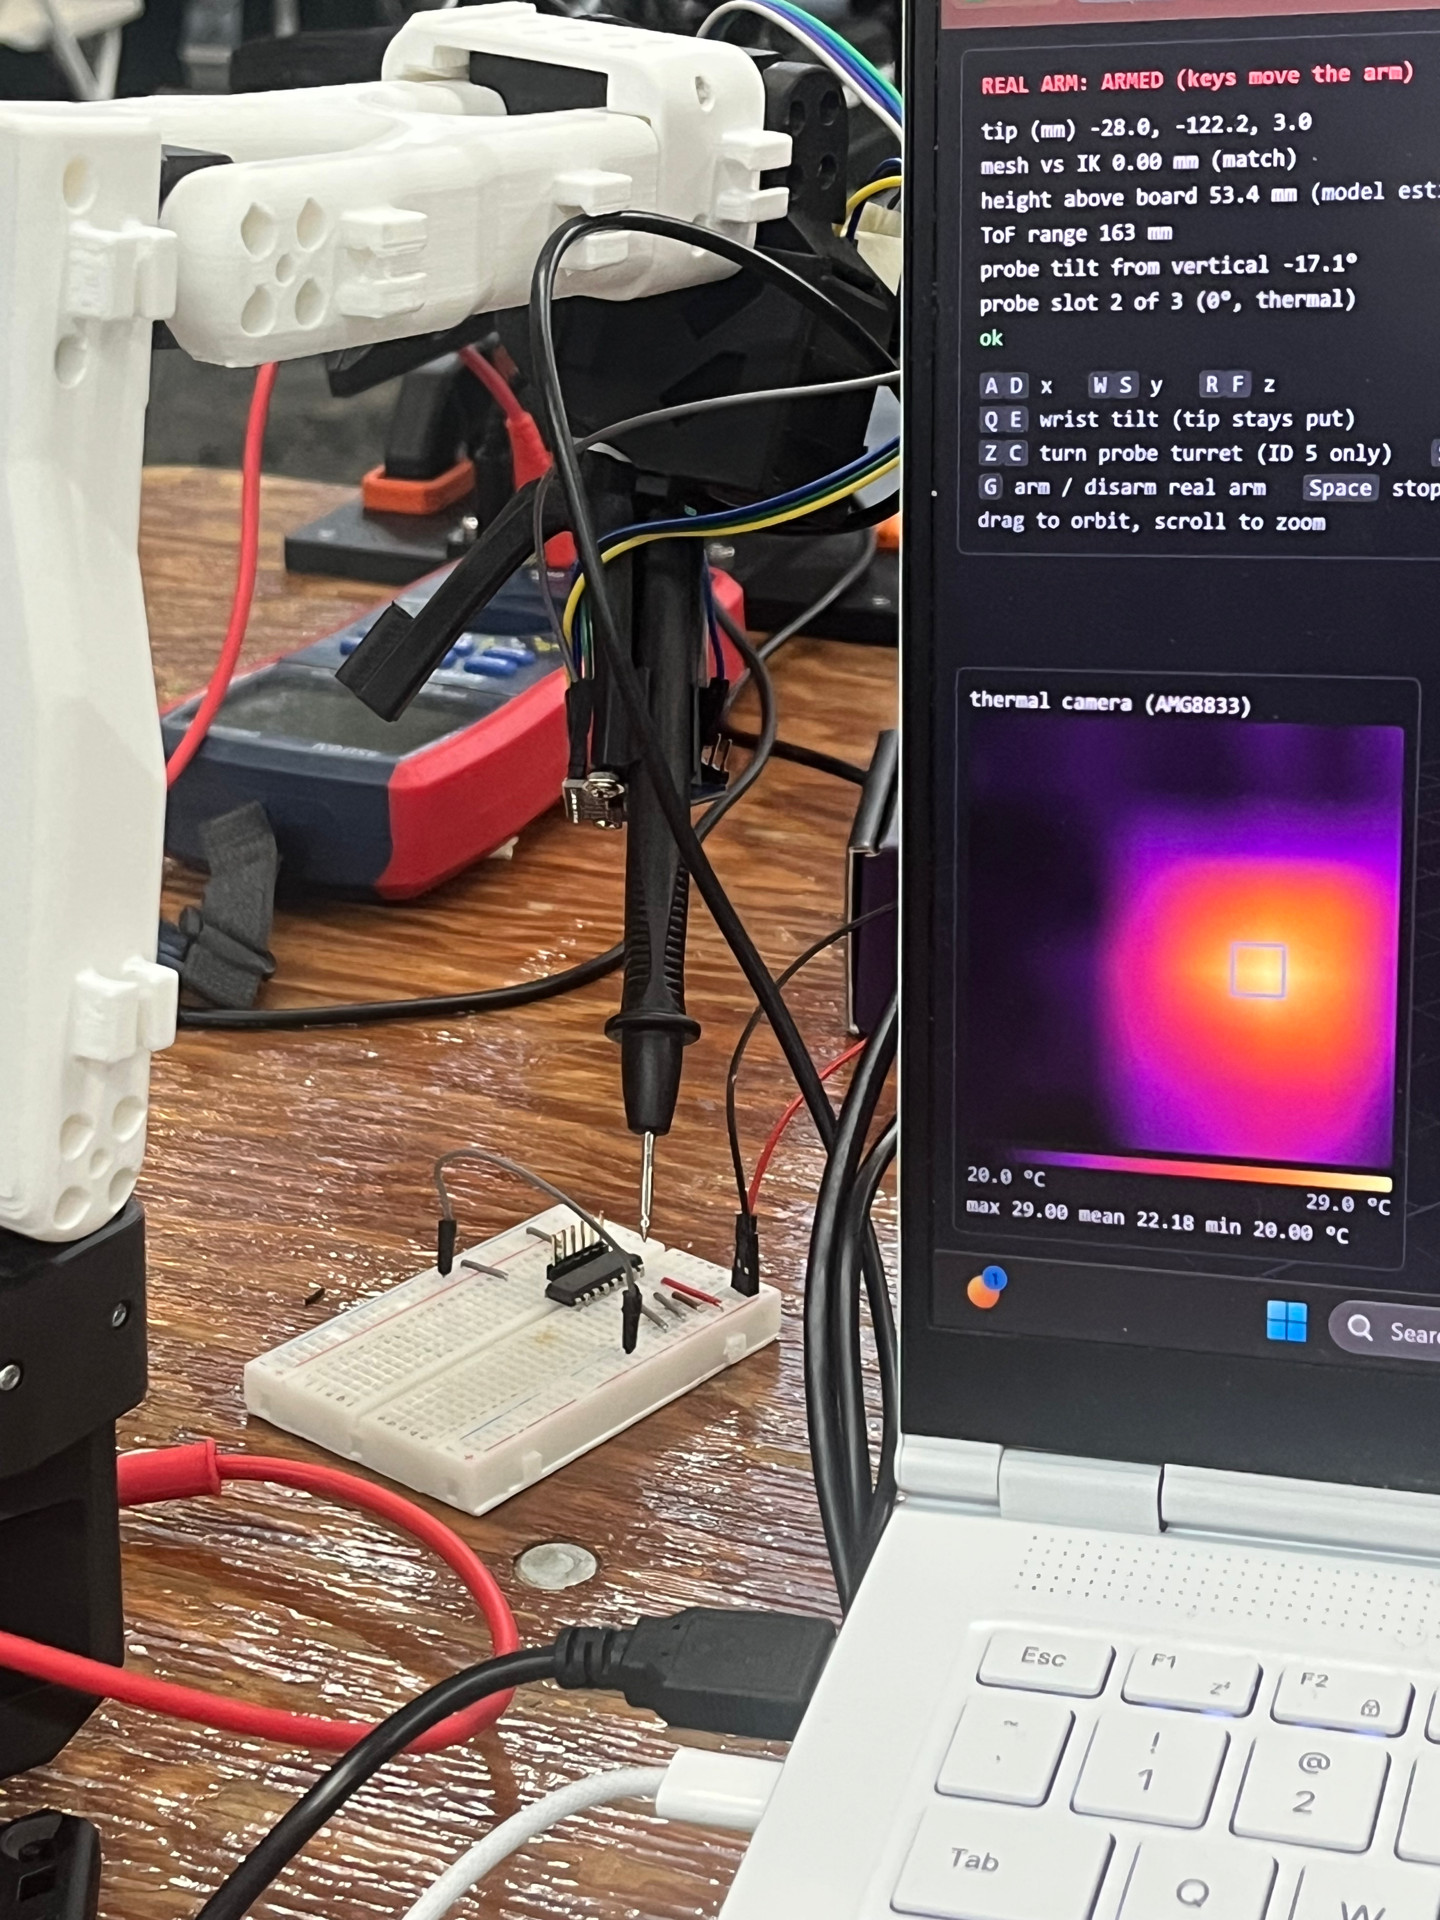
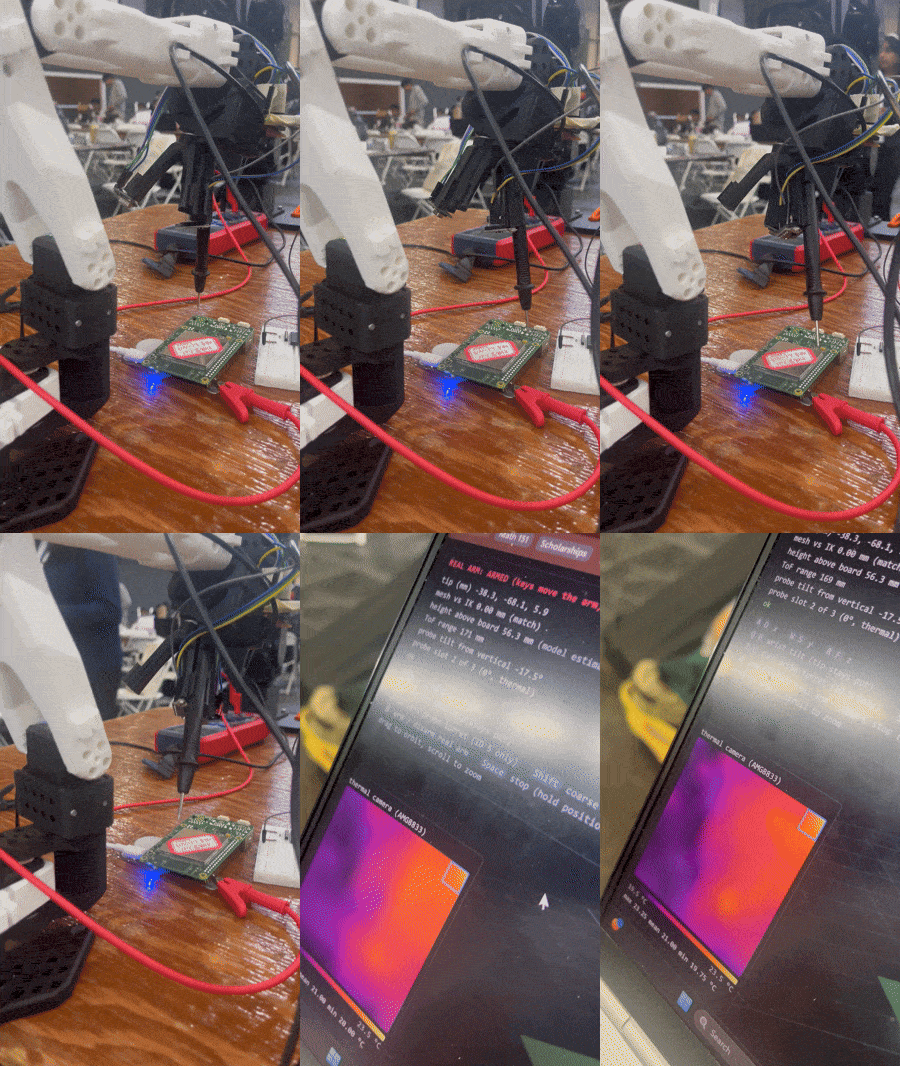
thermal footage of circuit with IC showing heat anomaly (swapped Vin and GND)
-
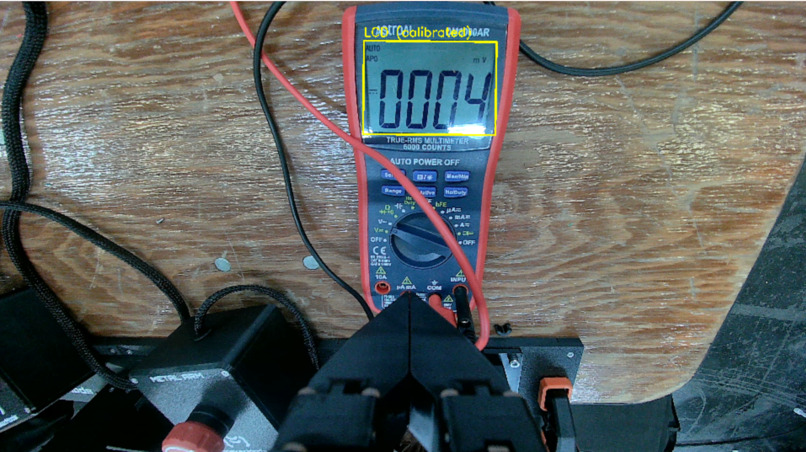
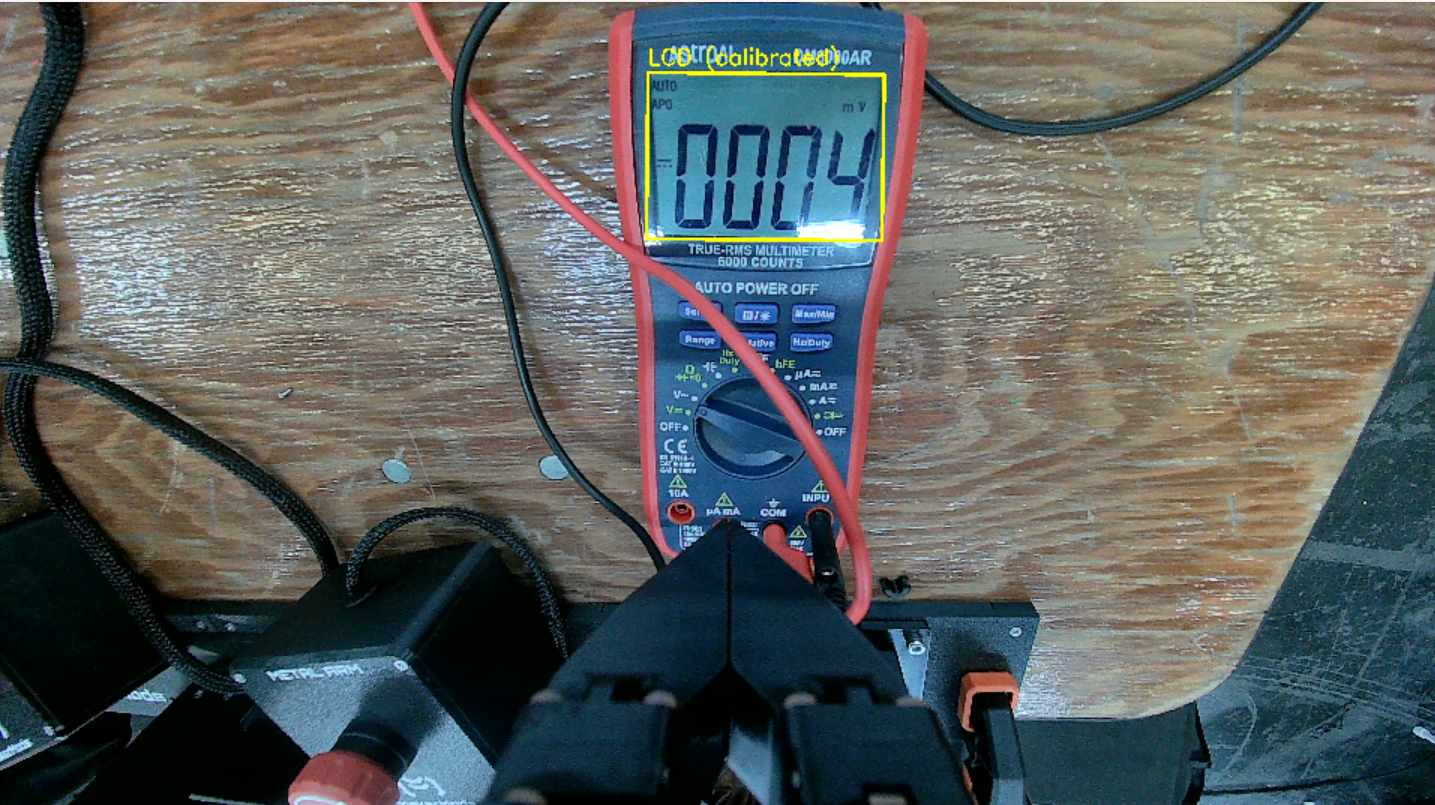
Multimeter Arm Camera View
-
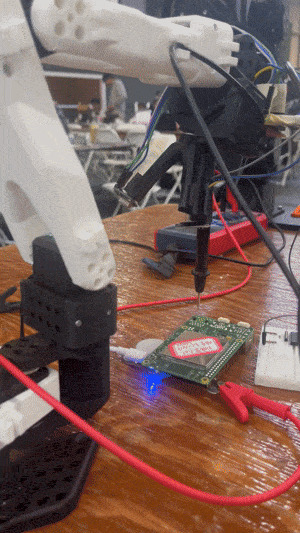 GIF
Probe Mode -> Thermal View
Inspiration
An AI can write firmware help design a circuit, even help architect an embedded system, but LLMs lack of access to the physical world limit's their capabilities with embedded systems and human physical labour becomes the bottleneck.
We wanted to give the agent a way to ask the circuit itself. PinPoint connects an AI's debugging process to a physical test bench.
PinPoint houses a comprehensive toolstack that real engineers use to debug and develop boards in production. Including a Logic analyzer to analyze communication between integrated circuits and peripherals, a multimeter to check electrical relationships, an oscilliscope to measure precise timings and a thermal camera to identify shorts or miswirings.
What it does
PinPoint is an MCP server and physical manifestation for hardware troubleshooting. MCP is the interface an AI agent uses to call tools. We're building tools around robot movements and electrical instrumentation with an abstracted control layer for speed, consistency, and token efficiency. Our solution allows an agent like Claude to request a measurement and use the result to investigate a fault.
Our first user is an AI agent building hardware. When a circuit behaves differently from what the agent expects, the intended workflow is simple: choose a registered test point, request a measurement through PinPoint, and use the evidence to decide what to check next.
We're starting with a simple circuit and a demo of the arms probing it. The current software includes the MCP interface, a simulator, and instrument capture tools. The complete physical measurement loop is still being integrated. The goal of this project is to further abstract the engineering debug process to lower barrier of entry to hardware engineering, similar to what LLMs were to software engineering.
How we built it
We built the MCP server in Python with FastMCP and Pydantic. The interface accepts named electrical targets rather than asking the model to invent physical coordinates. A separate measurement orchestrator is responsible for translating a target into a bench operation.
The robot software describes the arms and rotating toolheads with URDF models. Our solution then uses a suite of Computer vision techniques, combining modern transformer based vision models with traditional CV techniques such as PNP, contrast segmentation, and regression masking.
Our instrument tools connect an Analog Discovery 3 through the WaveForms SDK. They expose waveform capture and logic capture through MCP. These tools read at the probes' existing positions and explicitly report that placement and electrical contact haven't been verified.
The measurement interface checks the evidence before returning a usable reading. Results include the target, status, units, and execution checks. Reusing the same request ID returns the saved result rather than repeating a move. An SQLite journal preserves uncertain operations across restarts.
The hardest part was poking the probe on the desired pin on the PCB. We needed hyperprecise sub millimeter precision movements all while the process had to be fast. Originally, we played around with Jev by asking it every frame to detect the desired pins, but we ran into issues with latency and accuracy.
We also tried adding a separate stationary environment camera, but found it difficult to calibrate and to generalize across different components. We ended up using a single camera mounted on the arm, solving the board’s pose from calibrated intrinsics with PnP, and letting code, not the LLM, plan the motion. Jev only names the pad.
Pose from the camera was harder than it looked. Board segmentation broke on glare and wood grain, so we switched to matching silkscreen features against the KiCad reference. The board also sits rotated 180° on the table, which we only caught after a bad fit. Worst of all, the camera read the needle’s height as zero while the needle was still hovering above the board. That is why we added a time-of-flight sensor on the probe mount for the descent, with encoders and servo load for the last millimetres.
Even with the pin’s position known, the servos fought us. Their stiction stops them 1 to 3 mm short of a small move, then jumps. Under load they sag. Closed-loop corrections dithered around the pad, so we switched to one big computed move followed by a few fine corrections, and we filtered the camera pose so the overlay stopped shaking. Tuning the servo gains for speed made the arm jerk and reset a servo, so we reverted to safe settings.
A failed probe contact can look like a circuit fault. A timeout can leave the software unsure whether an arm has stopped. Those cases matter when the next action moves real hardware.
We designed the interface to keep uncertainty visible. An unverified contact doesn’t become a zero reading. An uncertain operation blocks another measurement. A simulation stays explicitly labeled as a simulation.
Calibration is another challenge. Knowing which electrical point to test isn’t enough. The camera and arm geometry also have to agree on where that point is. The needle’s depth was off by about 26 mm until we calibrated it by hand-touching known pads. Each arm needed its own setup too: on our second arm, the wrist and shoulder pan ran backwards in the digital twin, and the joint ranges stopped short of straight down. Connecting those pieces to the live hardware remains part of our integration work.
Accomplishments that we're proud of
MCPs and agent tool calls aren't anything new or innovative, but the solution we are building is. We are proud to tackle a real problem that bottlenecks many builders.
One of the biggest challenges we ran into during this build was the vision and control stack. We implemented an innovative hybrid CV approach and achieved efficiency and accuracy.
What we learned
For physical debugging, a number needs context. The agent needs to know which point the bench tested, whether contact was valid, and whether the operation finished. We made that context part of the measurement contract.
We also separated the model's electrical reasoning from the bench's positioning work. The agent chooses what it wants to know. The bench handles how to measure it.
What's next for PinPoint
Over the course of this project our team has realized that the form factor for a solution like this is not optimal in the form of a robotic arm. A more optimized form factor that we envision for this project is a motorized spider pin tool, typically used for data recovery.
Our end goal is to build an autonomous debugger that can root cause devices and propose solutions. Empowering builders to break through bottlenecks autonomously.


Log in or sign up for Devpost to join the conversation.