-
-
Neural Network UI
-
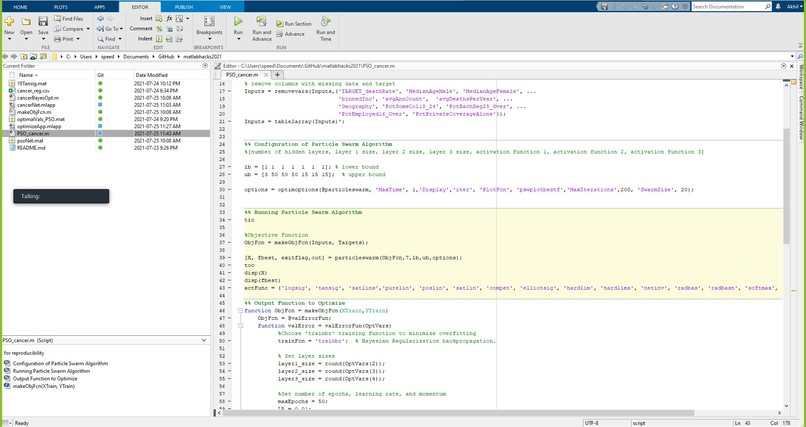
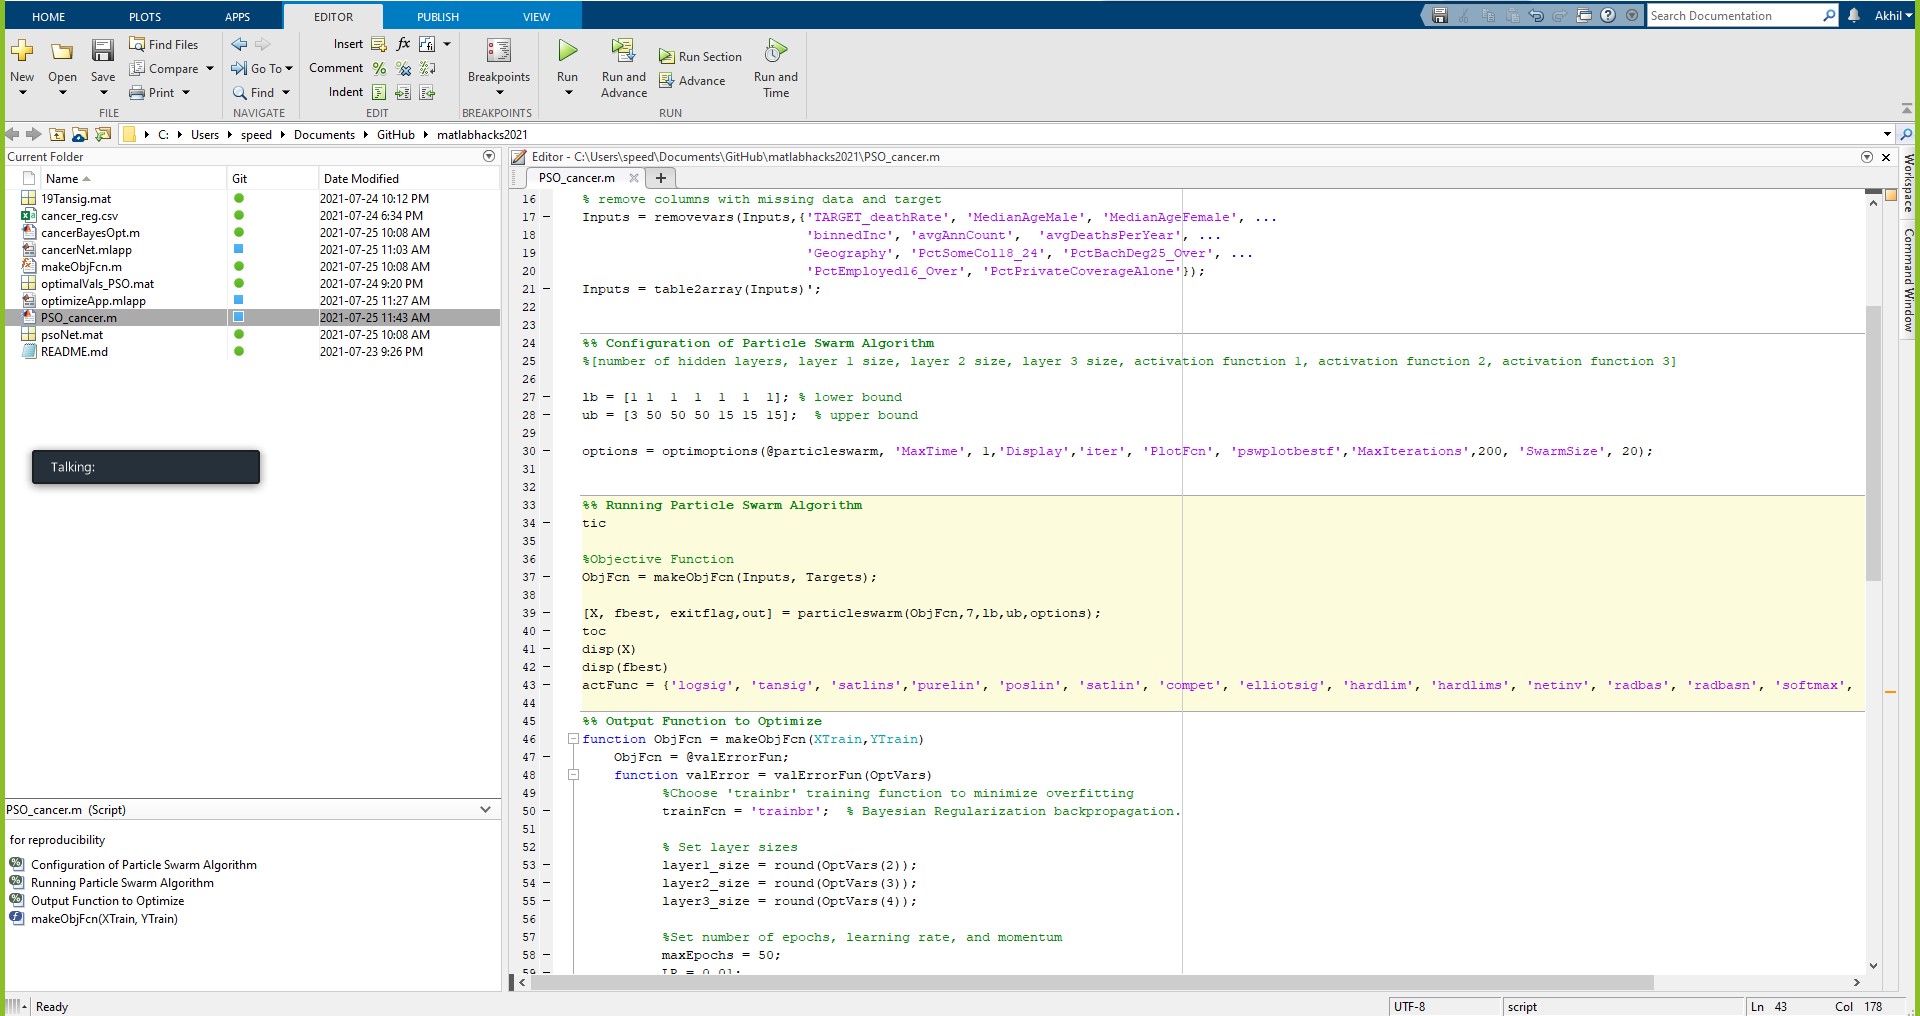
Particle swarm code
-
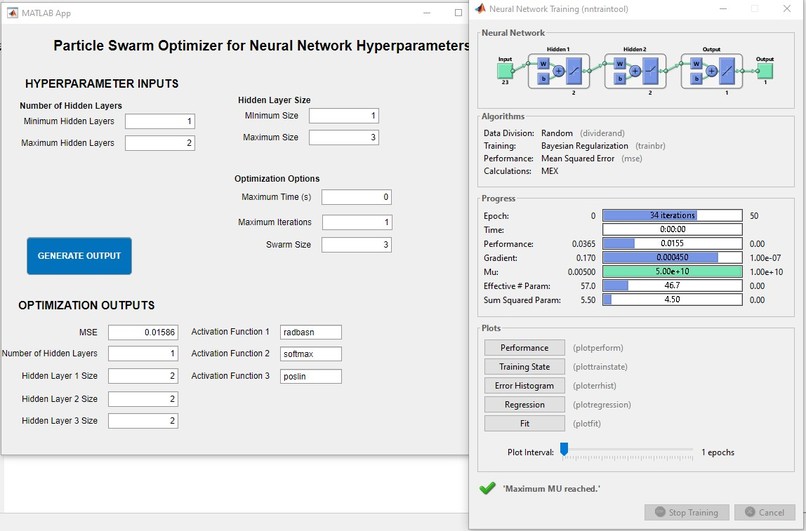
Particle swarm UI

Inspiration
We were inspired to work on this project when brainstorming what kinds of factors other than biological ones could predict the impact a disease has on a certain population. As such, we decided to examine how the demographic breakdown of a given area affects the cancer mortality rate, and we developed a regression network which predicts this to great accuracy.
What it does
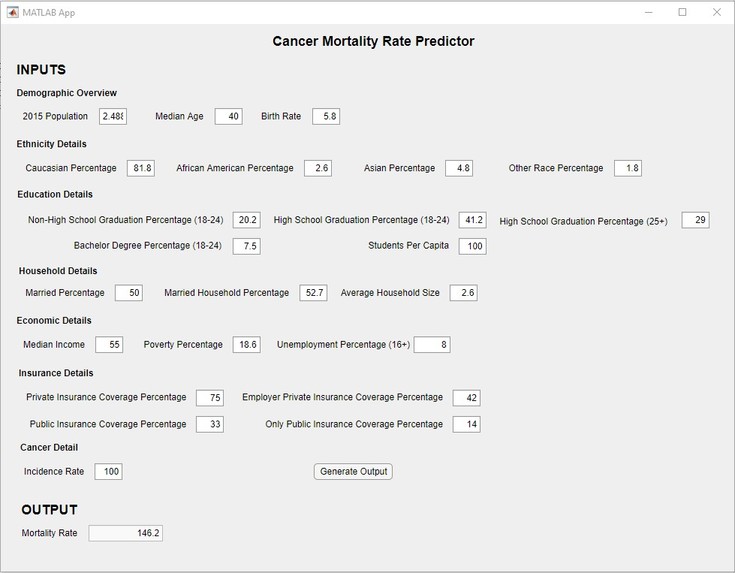
Using demographic data collected from US counties (such as median income, racial breakdown, percentage of marriages, etc.) our dataset predicts the mortality rate of cancer in said county. Included with our project is a user-friendly app which allows users to enter demographic data points they have collected and record what the cancer mortality rate is. As well, a neural network optimization app is available for users to experiment with optimizing the network's hyperparameters with a quick, easy-to-use GUI.
How we built it
We built our project in MATLAB using the deep learning toolbox to create our regression network. In order to optimize the hyperparameters for this network, functions from the Global Optimization Toolbox were used such as Bayesian Optimization and Particle Swarm Optimization. In addition, MATLAB's App Designer was used to create a user-friendly GUI which allows clients to run the neural network on demographic data they have collected and determine the predicted cancer mortality rate, and to optimize the network's hyperparameters themselves with Particle Swarm.
Challenges we ran into
We ran into the usual challenges of incorrect datatypes in incorrect places, improper input formatting for the network, and more. With our network, we had to deal with abnormally high errors and complex datasets. We resolved these challenges by looking into proven techniques to solve them: categorical/ordinal encoding, removal and creation of boolean columns for entries with missing values, and research into strategic hyperparameter optimization.
Accomplishments that we're proud of
Besides accomplishing our goal and putting out a working and well-developed final product, we are proud of our ability to learn and debug on the fly. We initially began by working on a classification-type problem and encountered many challenges. For example, we had to deal with categorical encoding, missing values, and differing performance depending on our choice of normalization technique.
We read through countless documentation pages, Stack Overflow posts, and persevered through these issues and resolved them. In the end, we successfully developed an extremely accurate network and a clean UI that aids the use of the network.
What we learned
We gained great insight into the use of optimization techniques for hyperparameter optimization. Tools like Particle Swarm Optimization and Bayesian Optimization are extremely effective and far more efficient than manual optimization (e.g. making decisions yourself, based on the results of a network). We explored and tested different network types (e.g. MATLAB patternnet, trainNetwork, classification network, etc.) in the Deep Learning Toolbox, before settling on using fitnet for this regression analysis.
Additionally, we developed our fluency in MATLAB by exploring new datatypes like categorical variables, symbolic datatypes, tables, among more.
What's next for Predicting Cancer Mortality Rates in US Counties
We are confident that our neural network's hyperparameters have been well optimized through the use of both Bayesian Optimization and Particle Swarm Optimization. Our next steps include: 1) analyzing the relationship between each input parameter and our target mortality rate. Using this information, we can determine which demographic/economic characteristics are most influential in impacting the mortality rate. 2) refining the network and minimizing the number of input parameters (using the conclusions from 1), while maintaining the accuracy of our network's results.
Built With
- matlab
- matlab-app

Log in or sign up for Devpost to join the conversation.