-
-

Homepage
-

Readability comparison graph
-

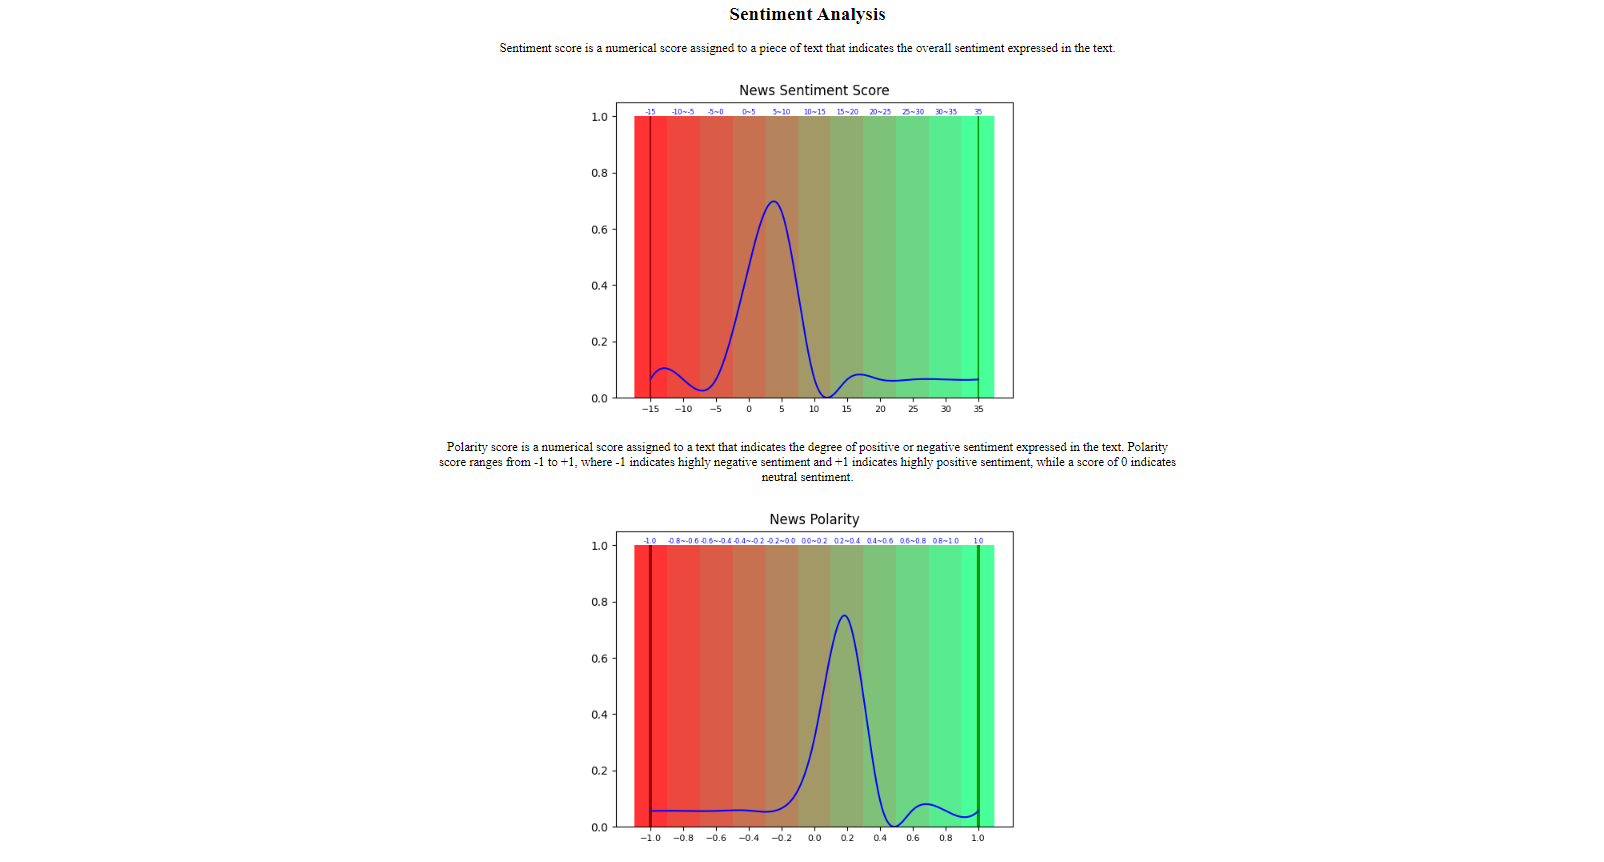
Sentiment analysis graph
-

Frequency comparison graph
-

Wordcloud
-

Top 100 people mentioned in factual news bubble graph
-

Top people mentioned in factual news pie chart


Inspiration
Inspired by the human brain's innate ability to process visual information more efficiently and effectively than raw numerical or textual data.
What it does
Our data visualization tools provide a comprehensive overview of news articles, enabling users to quickly identify patterns, trends, and anomalies in large data sets.
How we built it
We used Spacy, Python NLTK, TextBlob, pandas, etc to preprocess data and perform text analysis. We used matplotlib and D3 JS to our visualization, and our web app is built on top of express js and node js
Challenges we ran into
It was difficult to use D3 JS as most of us are used to using Python frameworks to visualize data, many of us had to watch tutorials and read many documentation, but we were able to overcome this challenge by persevering through it and never giving up :)
Accomplishments that we're proud of
We are proud that we built a fully functioning web application for our data visualization tool, and we used a lot of data analysis natural language processing techniques with NLTK and Spacy
What we learned
We learned how to use D3 JS library, it was the most difficult but we are glad that we overcame the initial steep learning curve and made something really cool and exciting.
What's next for News Guardian
We want to add more features, make graphs and charts more interactive, and potentially a detector for fake news and propaganda.
Built With
- d3.js
- express.js
- gensim
- javascript
- matplotlib
- nltk
- node.js
- python
- spacy
- textblob


Log in or sign up for Devpost to join the conversation.