-
-
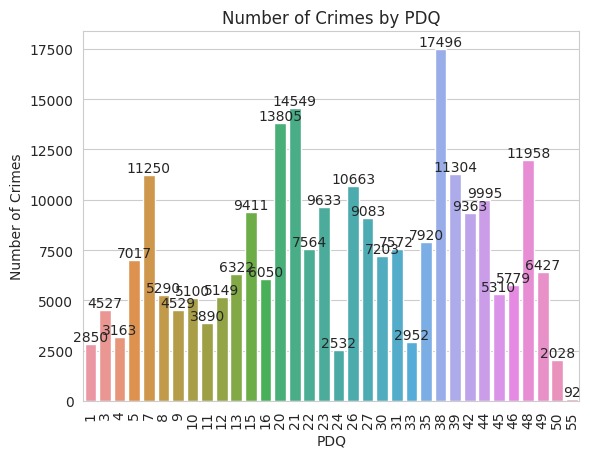
Count of crime in Different Precincts
-
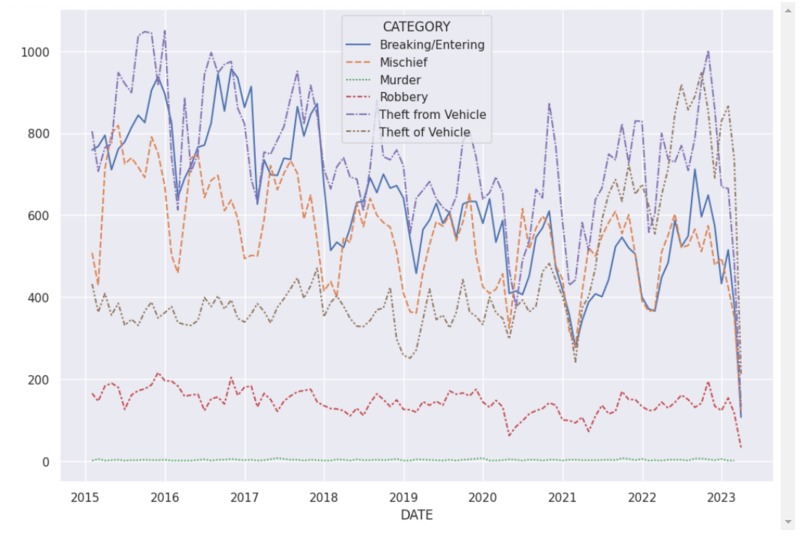
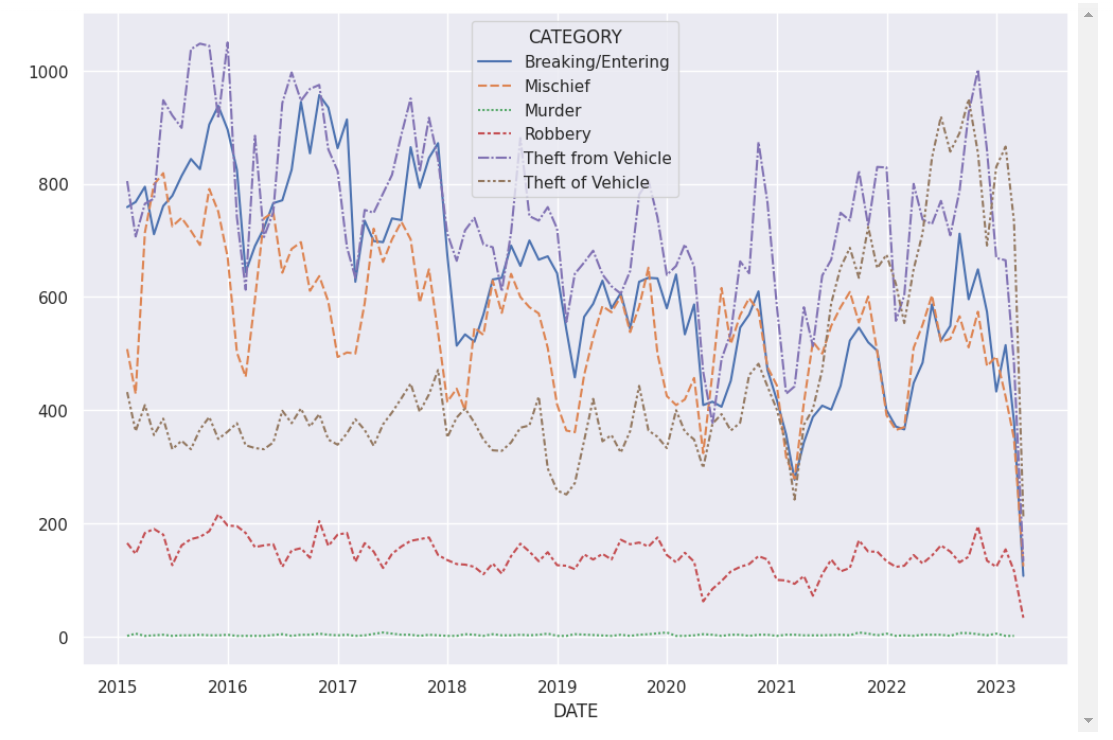
Trends of crime categories over Time
-

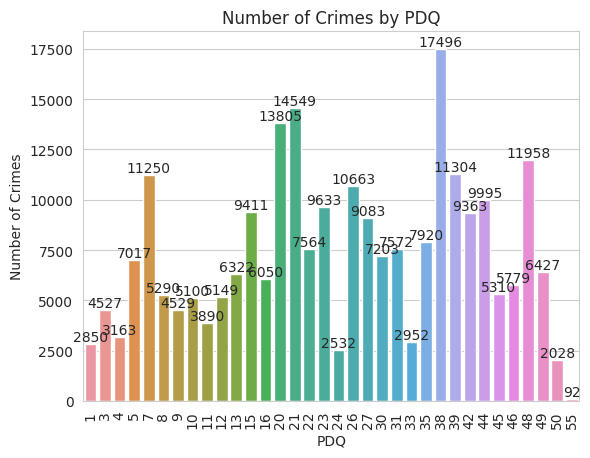
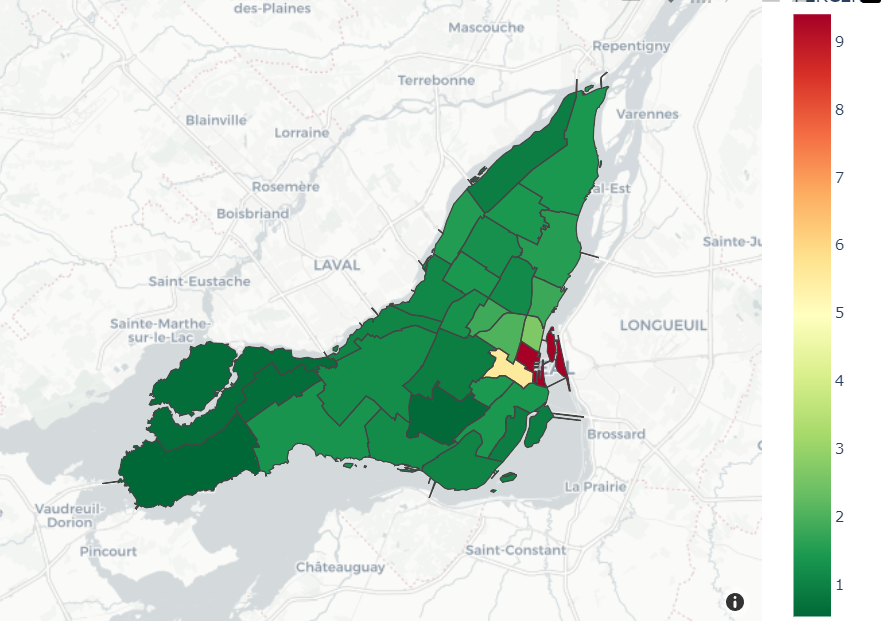
Crime ratio over Precincts
-
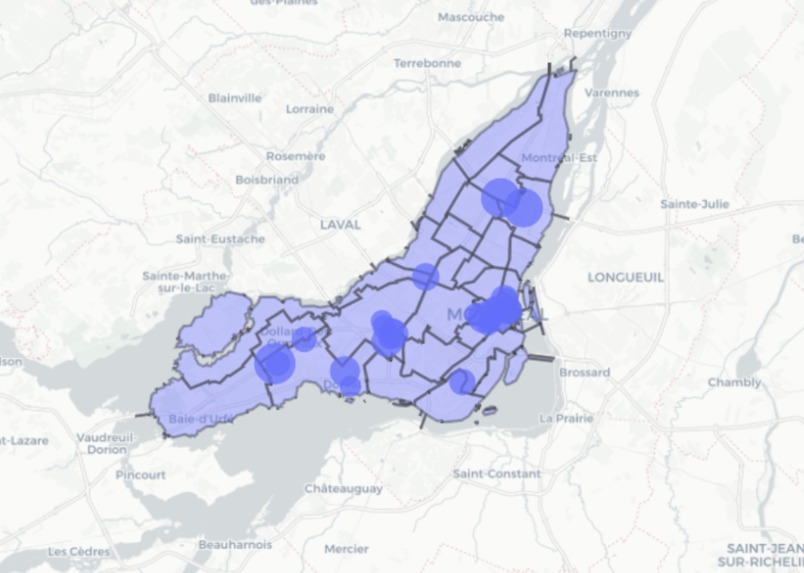
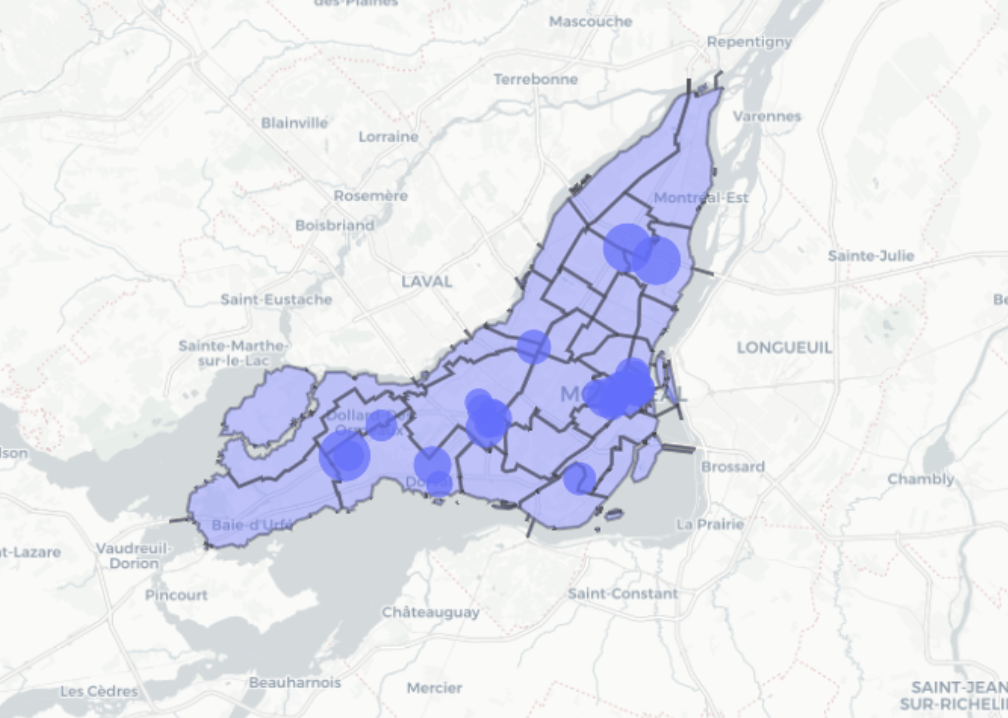
Density of Crime Count using Bubble Map
Overview
There is a story behind every piece of data. Given a dataset of almost 250 thousand crime reports, and assuming the prestigious role as advisors for the City of Montreal, Canada, we used data analytics and machine learning to gain a deeper understanding of the criminal landscape, political climate, and effectiveness of current policies. From this, we were able to formulate policies that help prevent crime, increase citizen confidence in their government, and address issues concerning Montreal’s law enforcement.
Approaching the Data
Pre-Processing
Because the data set was initially in French, we quickly translated and replaced all the labels into English for ease of reading and use. We also identified the 42 thousand data points with null coordinate values, and realized it would bias our results by a large margin.
Preliminary Analysis
To gain a better understanding of our data, we answered some preliminary questions with descriptive statistics and data visualizations. The top 3 most prevalent crimes were Theft from Vehicle at 29.5%, Breaking/Entering at 24.9%, and Mischief at 21.9% of all crimes committed. The top 3 precincts with the absolute highest count of crime were Precinct 38 with 17,496, Precinct 21 with 14,549, and Precinct 20 with 13805. On the other hand, Precinct 55 with 92, Precinct 50 with 2,028, and Precinct 24 with 2,532 cases reported stood at the lower end of the spectrum.
Diving deeper, we began to notice the stark disparities between the amount of criminal activity in some precincts in comparison to others. To understand these outliers in our data, we looked for context throughout Montreal’s history and found the answers we were looking for. According to the Service de police de la Ville de Montreal’s (SPVM) official website, Precinct 55 and 50 are airport and subway precincts, respectively [1]. This accounts for the relatively low criminal activity in the area, as it presided over no local populations and less traffic in comparison to other locations. While observing the other outlying precincts, we noticed abrupt cutoffs in data after certain years and the disappearance of those precincts in our choropleth map when mapped against our second data set of verified police precincts. Once more, on the SPVM website, it detailed the merging of Precinct 24 into 26 in January 2019, Precinct 11 into 9 in September 2020, and Precinct 33 into 31 in Spring 2022. Noticing these discrepancies in precincts allowed us to ignore these biased data points and gain a more accurate picture.
Testing Hypotheses
Before formulating our policy recommendations, we wanted to determine how certain demographic or geologic features could affect crime rates. We researched current government initiatives and noticed that the city has been actively pushing for employment in the city police force [3]. This motivated us to compare Statista data on number of police officers in the city with number of crimes to observe the trends. We found a positive correlation (decreasing police forces along with decreasing amount of crimes), however it was not strong enough to prove causation [4]. We also hypothesized that the merging of precincts could increase crime rates, but disproved it after comparing the sum of crime rates pre- and post-merge. Our one successful hypothesis was proven when while plotting the crime rate (crimes/population) of each precinct and looking for hotspots, we were surprised to see that a small area on the east of Montreal had a very high crime rate. We deduced that this could be due to gang activity in the area and verified this hypothesis by reading the SPVM’s reports on the areas [2].
Creating our Policies
The policies we have created aim to effectively reallocate law enforcement resources to improve public safety and reduce crime rates. After analyzing the crime data based on factors such as the time of day, type of crime, and location, we identified high-impact areas and times, specifically Precinct 20 and 21, that require special attention and therefore more resource allocation. The first policy focuses on optimizing the deployment of police officers by adjusting the number of officers on duty and their specific patrol areas and times to the identified high risk areas.
However, resident surveys from the SVPM and local news articles reveal that the public have a poor opinion of the police, with the Defund La Police Campaign even advocating for a 50% cut in budget with the support of the majority of Montrealers [5, 6]. In order to accommodate for the possibility of the public being unwilling to accept this policy, we have proposed an alternative policy that does not revolve around the police force. We will bring their focus to the government’s social welfare initiatives by incentivizing personal efforts towards public safety. This policy targets the subset of precincts that have been identified as having high levels of crime, and incentivizes local companies to install security systems in these areas. Citizens would also be encouraged to install security systems in their homes to reduce the occurrence of breaking & entering and robbery. This policy is designed as an alternative strategy for crime reduction and does not rely on allocating additional funds to the police force. Instead, it empowers citizens to get better security by providing them with the choice to participate in the program and helps support local security system businesses operating in the area.
How We Built It
Collaboration was done on Deepnote and our team coded mainly in Python. For data analytics, we utilized the Pandas and NumPy libraries to construct data frames and arrays. We also used Plotly, Seaborn, and MathPlotLib for data visualization, and made use of descriptive statistics, bar plots, line plots, choropleth mapboxes, scatter mapboxes, and heat maps to gain different insights from different motivations.
Machine Learning
Our objective with machine learning was to go beyond our current understanding of the data and predict future trends. We constructed a Multivariate Long Short-Term Network, a Deep-Learning Neural-Networks Model for Time-Series Forecasting based off of the historical data to predict the trend of crime rates for the next five years. Our model returned a total loss of 168,229.90625 and a test accuracy score of 7.78%. Although our results were poor, this gave us a starting point to carefully consider specific factors/categories and their effect on data-driven advocacy moving forward. We hope to emphasize the importance and necessity of our proposed policies in the wake of rising crime rates. Our second model is XGBoost, a Classification Model on the categories: type of crime, date and time, and the property type (residence, school, transportation, shop, etc), in order to predict with an 80% accuracy with 3 returned records, the type of crime. This information was requested from the geographical API, Nominatim.
Challenges we ran into
- Our Deepnote kept on exceeding its hardware capabilities; had to make copies
- First time implementing Deep-Learning ML models; huge learning curve!
Accomplishments that we're proud of
- Found very interesting results & formed a story around it
- Completed first datathon!
What we learned
- Multiple data visualizations methods
- Deeper understanding of Machine Learning
References
- “Métro De Montréal - Poste De Quartier 50.” SPVM, Montréal, https://spvm.qc.ca/en/PDQ50/Pages/Team.
- “Métro De Montréal - Poste De Quartier 55.” SPVM, Montréal, https://spvm.qc.ca/en/PDQ55/Pages/Team-.
- “Important rappel | Intégration des postes de quartier 9 et 11.” SPVM, Montréal , https://spvm.qc.ca/fr/PDQ9/Actualites/14855.
- “PDQs 24 and 26 under one roof.” SPVM, Montréal, https://spvm.qc.ca/fr/PDQ9/Actualites/14855.
- “Intégration des PDQ 31 et 33 : des équipes plus efficaces réunies sous un même toit.” SPVM, Montréal , https://spvm.qc.ca/fr/PDQ31/Actualites/15106.
- “Resident surveys.” SPVM, Montréal, https://spvm.qc.ca/en/Fiches/Details/Resident-surveys.
- “Vers une pénurie de policiers au Québec?” Le Devoir, https://www.ledevoir.com/societe/660948/vers-une-penurie-de-policiers-au-quebec.
Built With
- classification
- deep-learning
- deepnote
- machine-learning
- numpy
- pandas
- plotly
- python
- regression
- seaborn


Log in or sign up for Devpost to join the conversation.