-
-
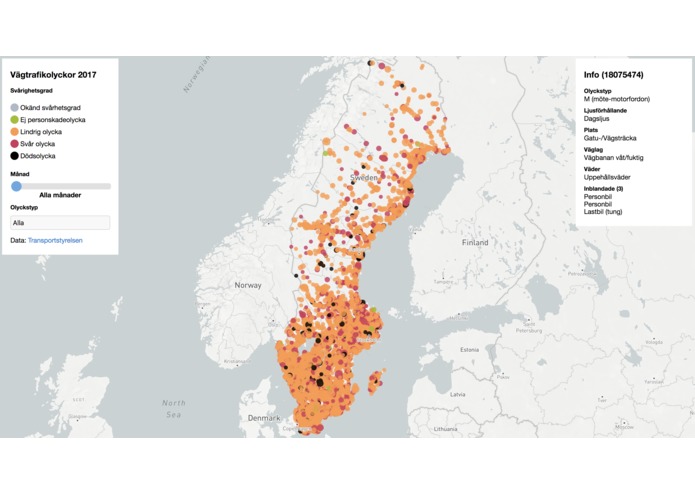
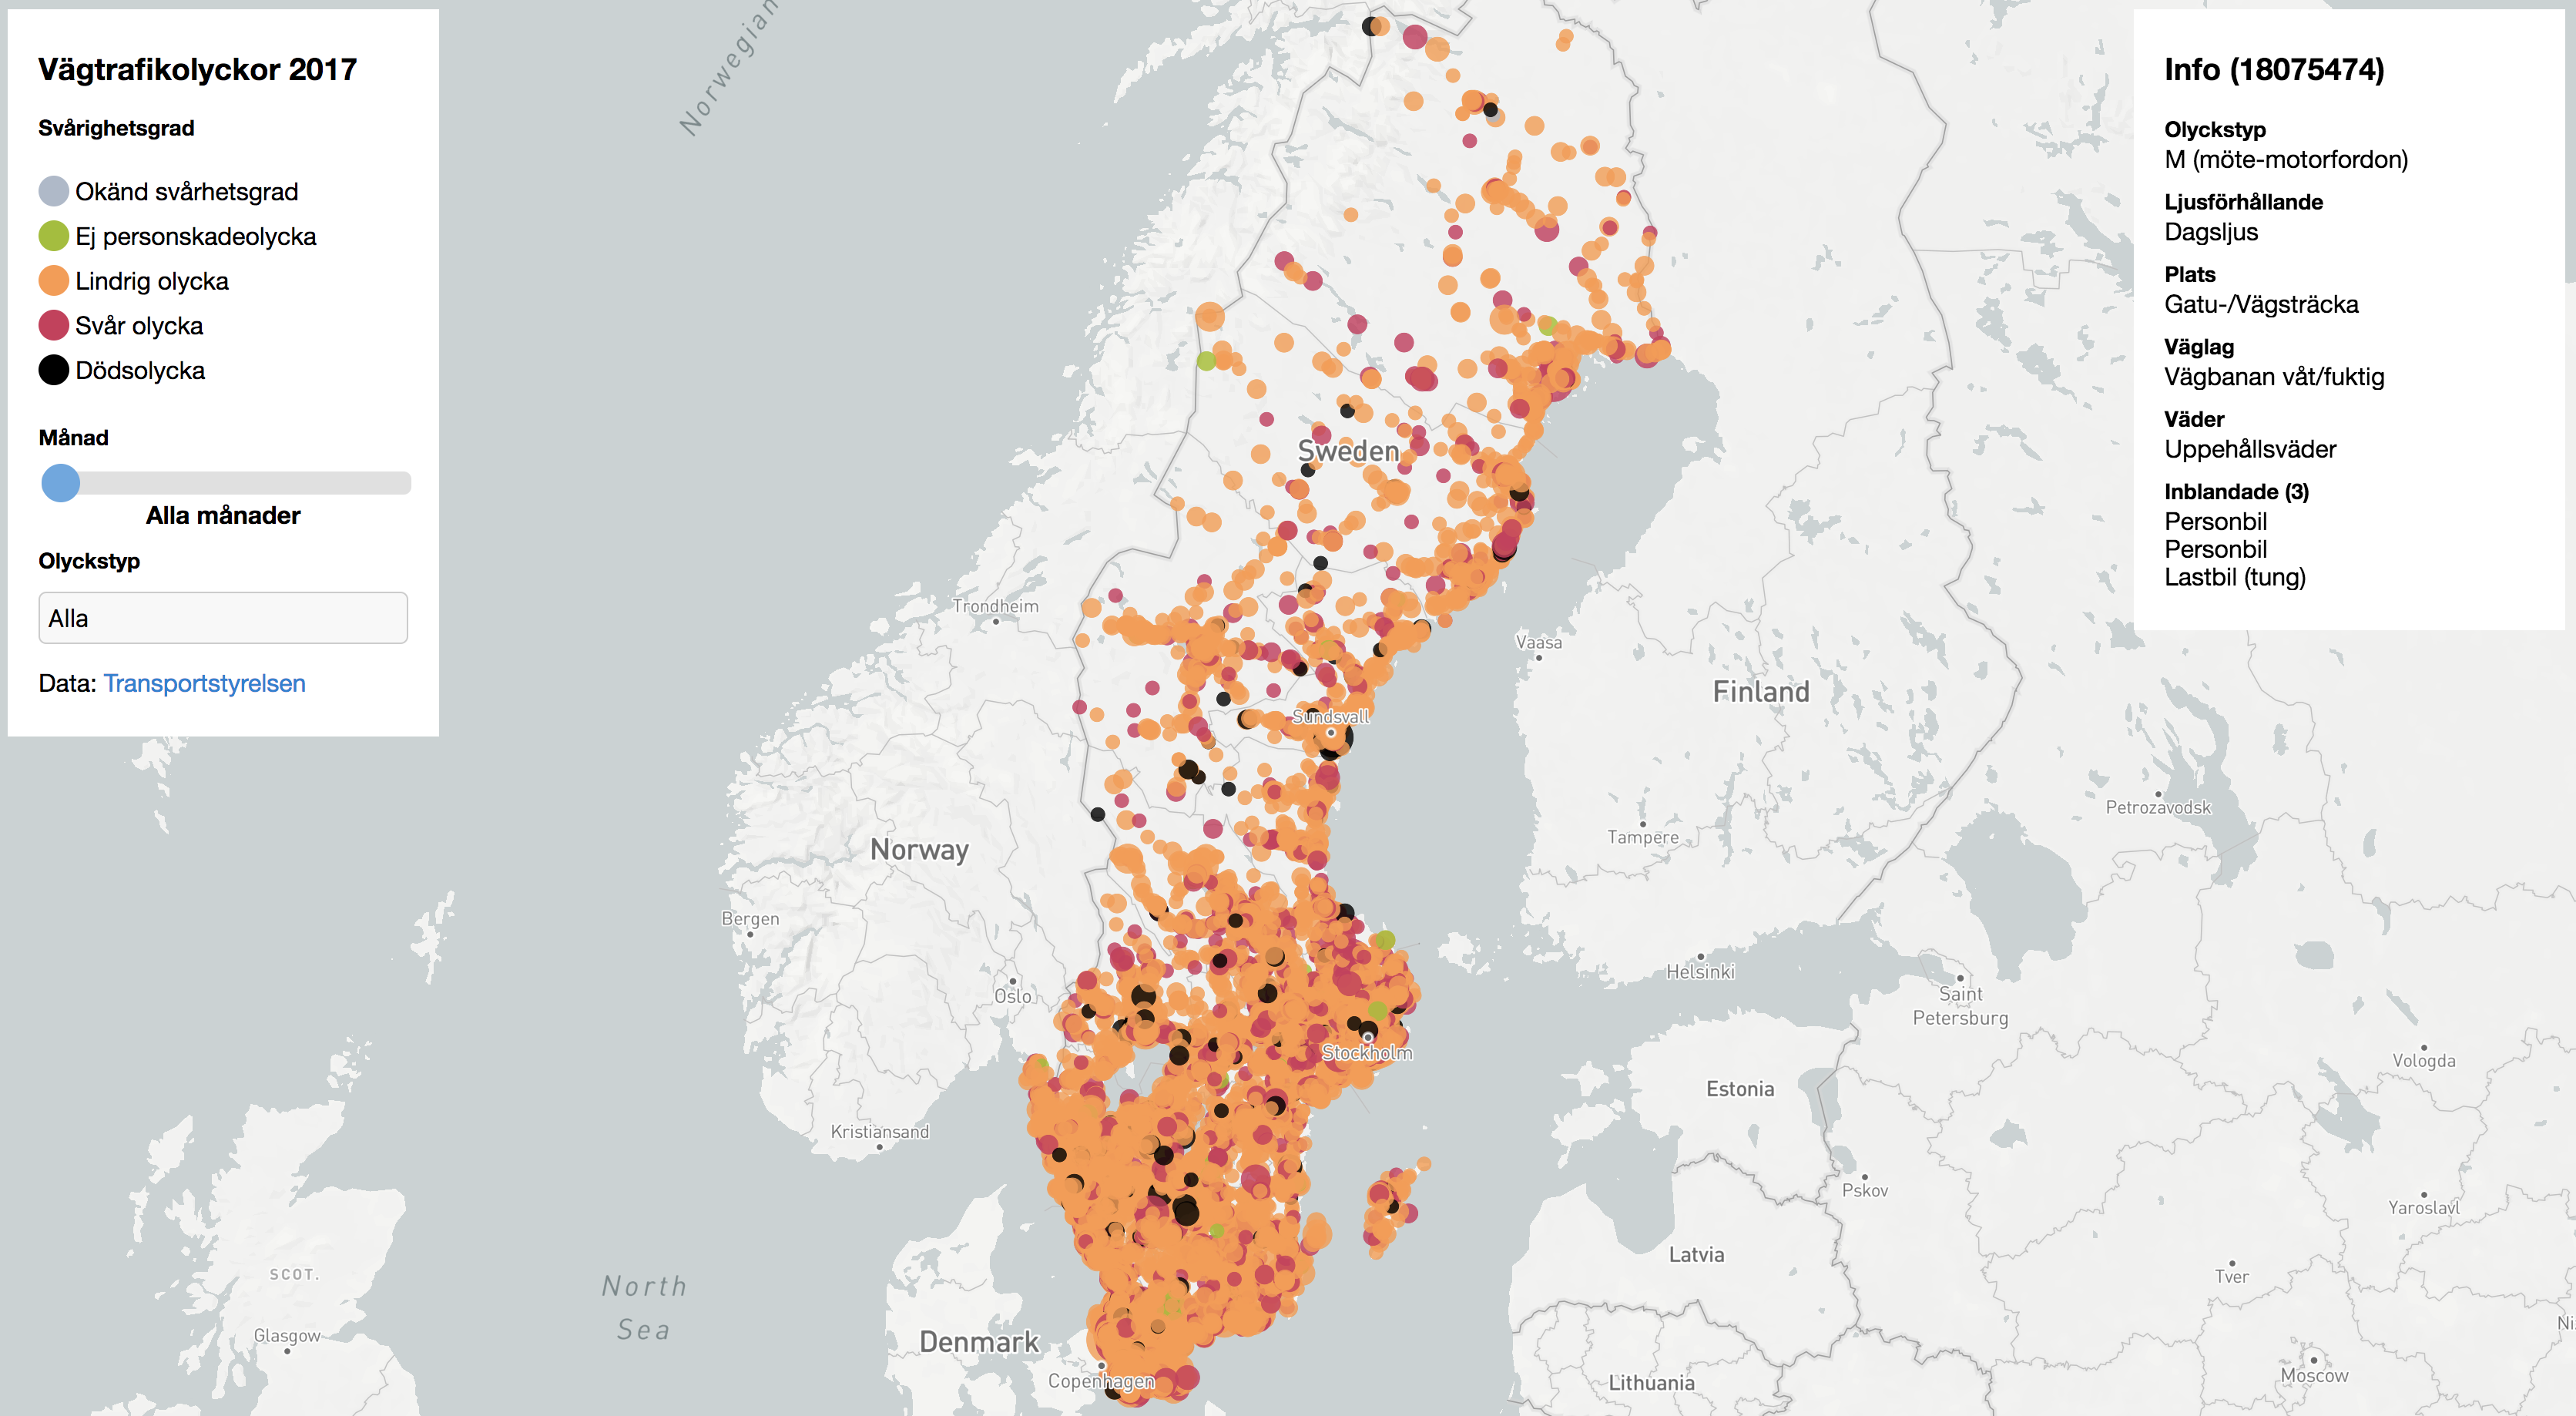
All accidents in Sweden during 2017
-
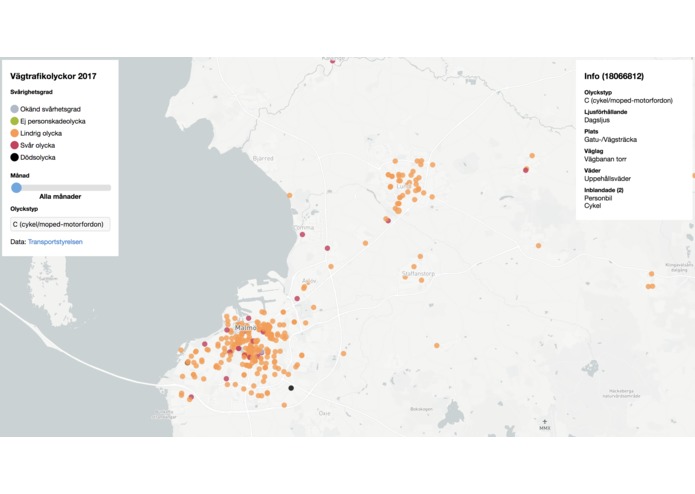
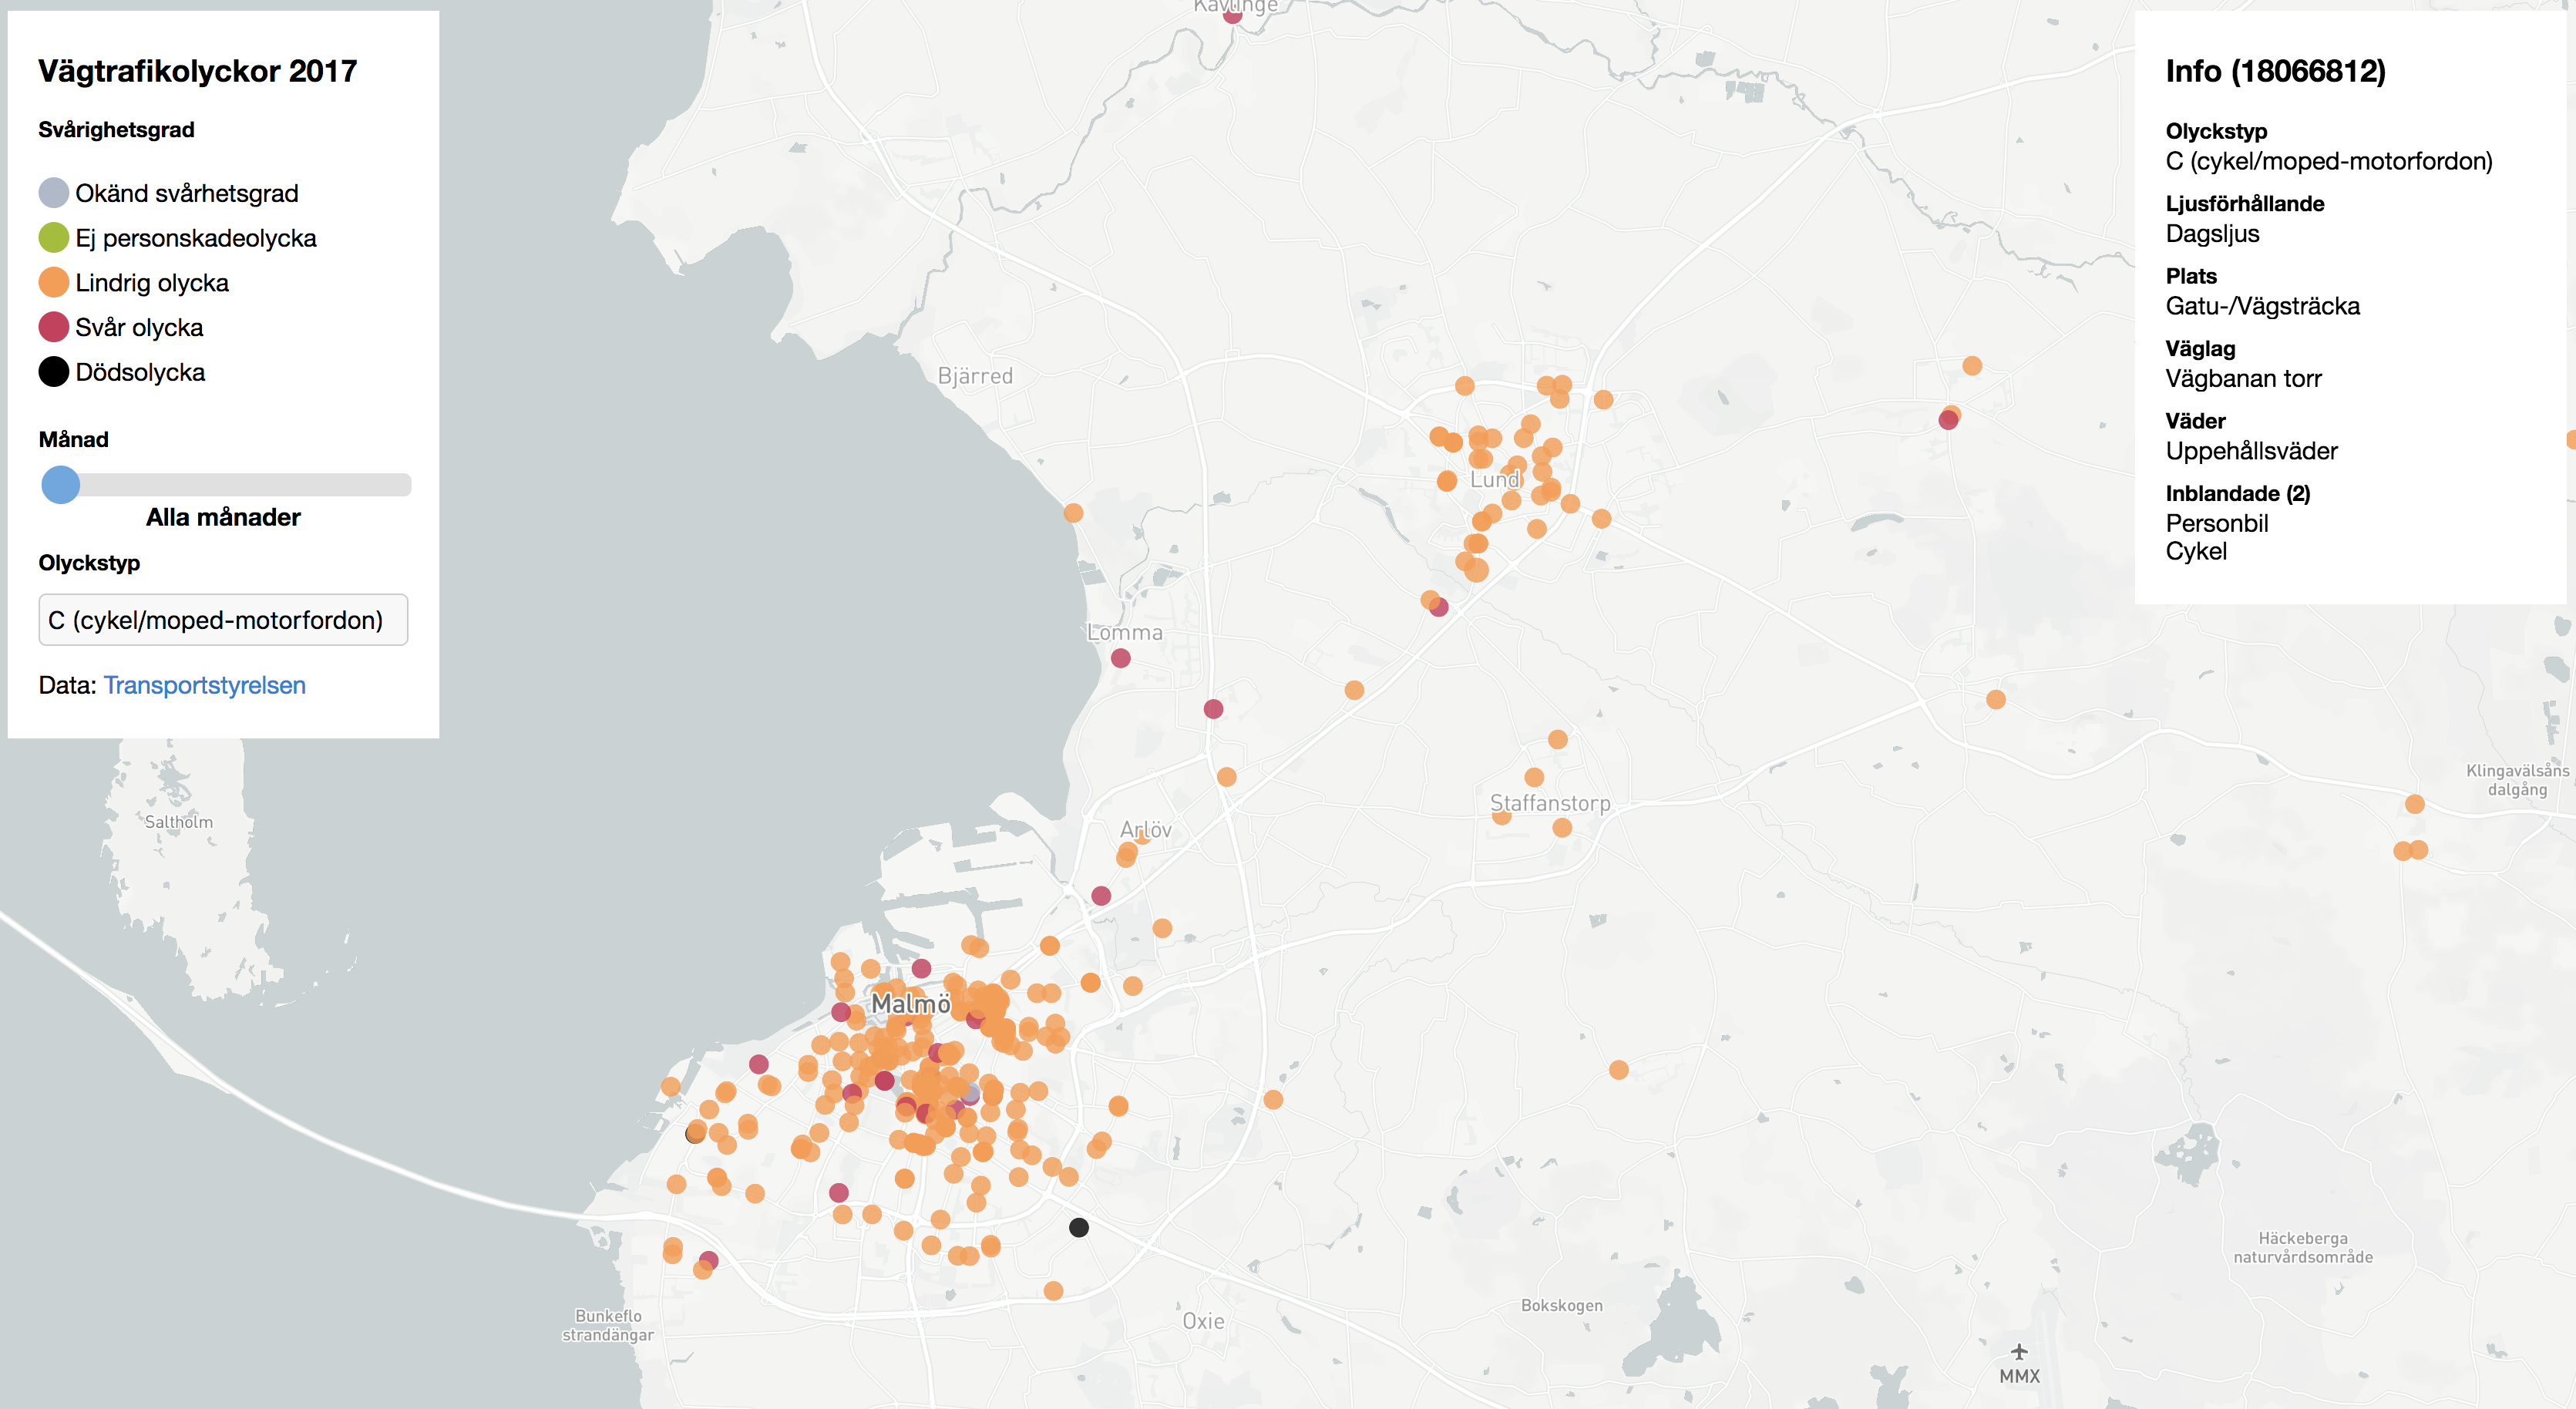
All bicycle accidents in Malmo/Lund during 2017
-
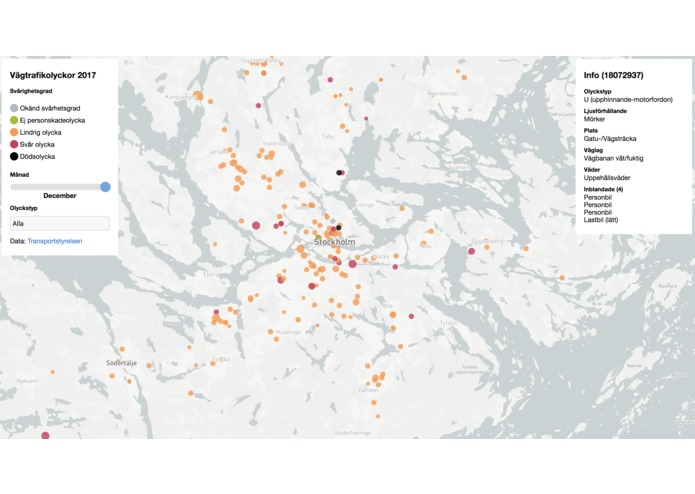
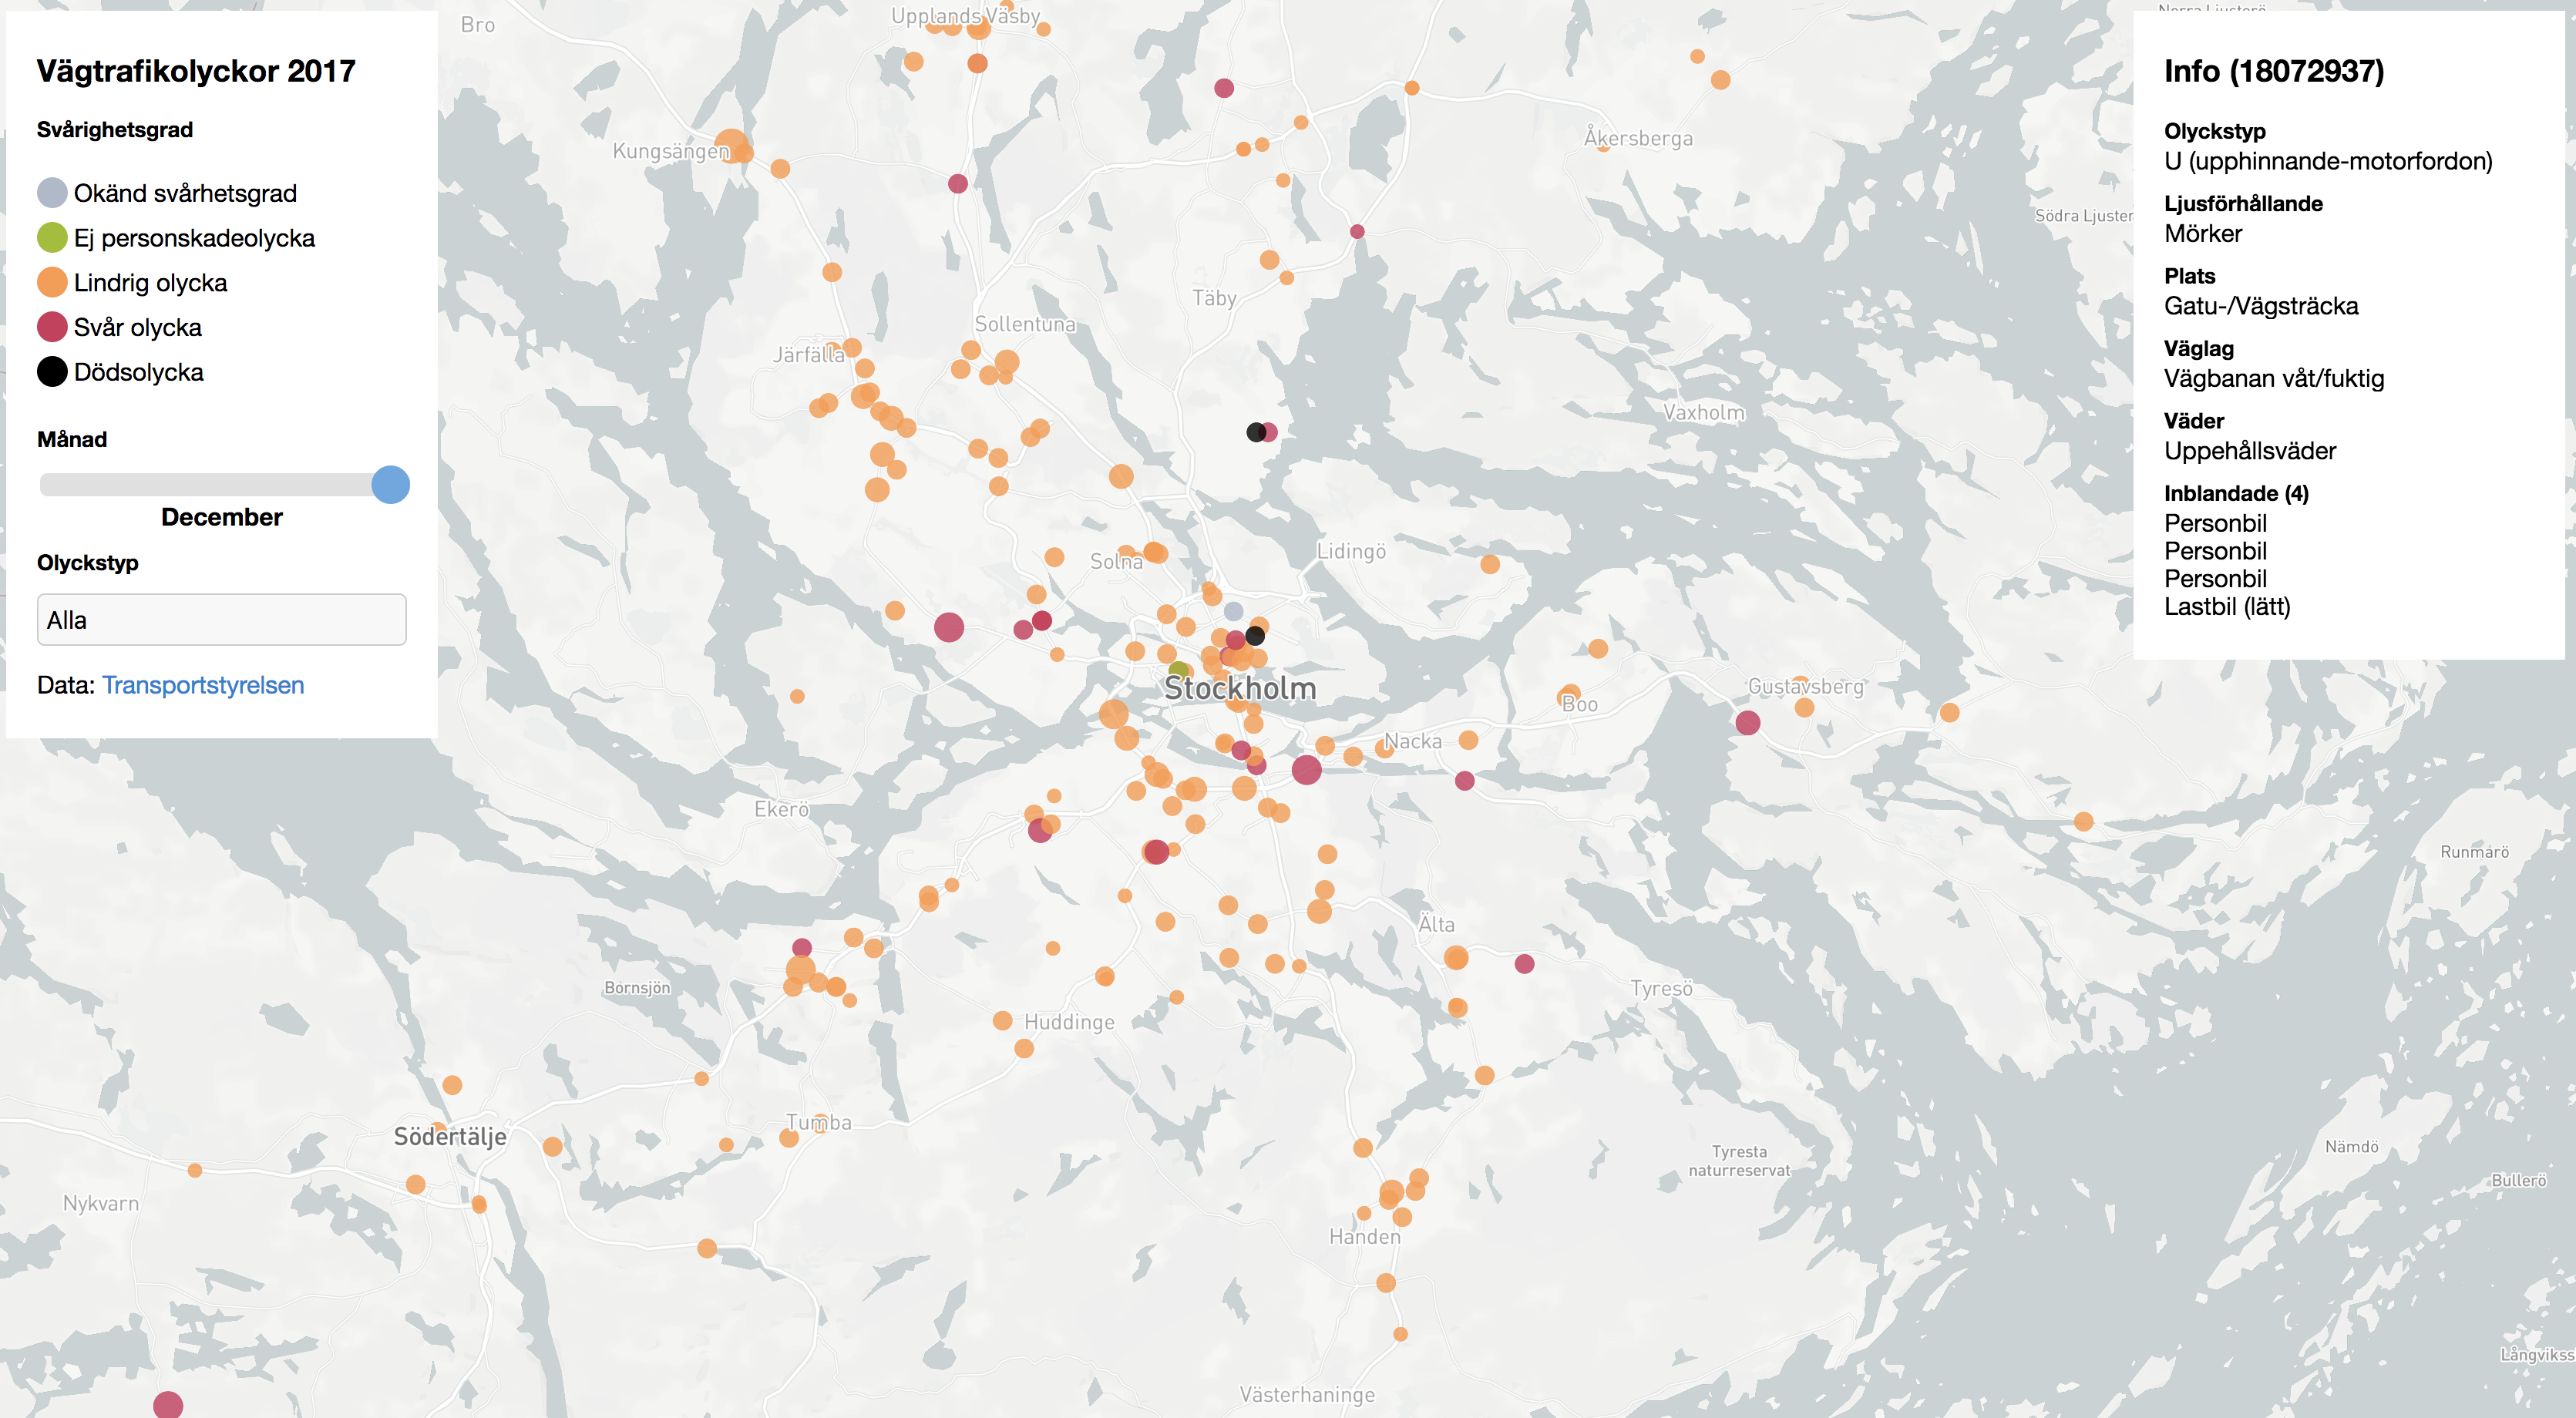
All accidents in Stockholm during December 2017
-
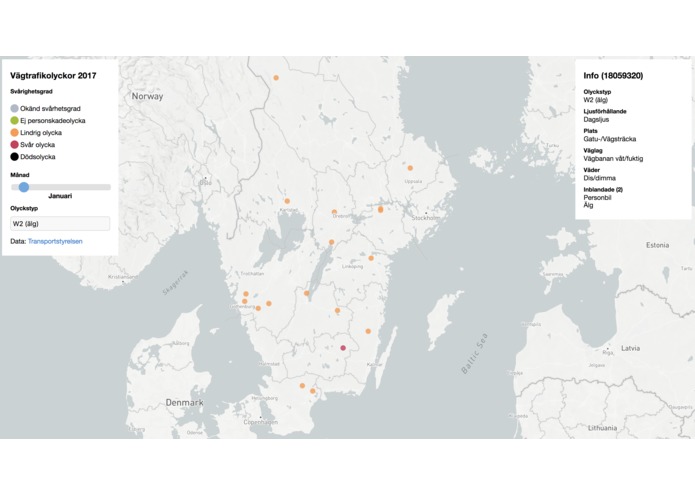
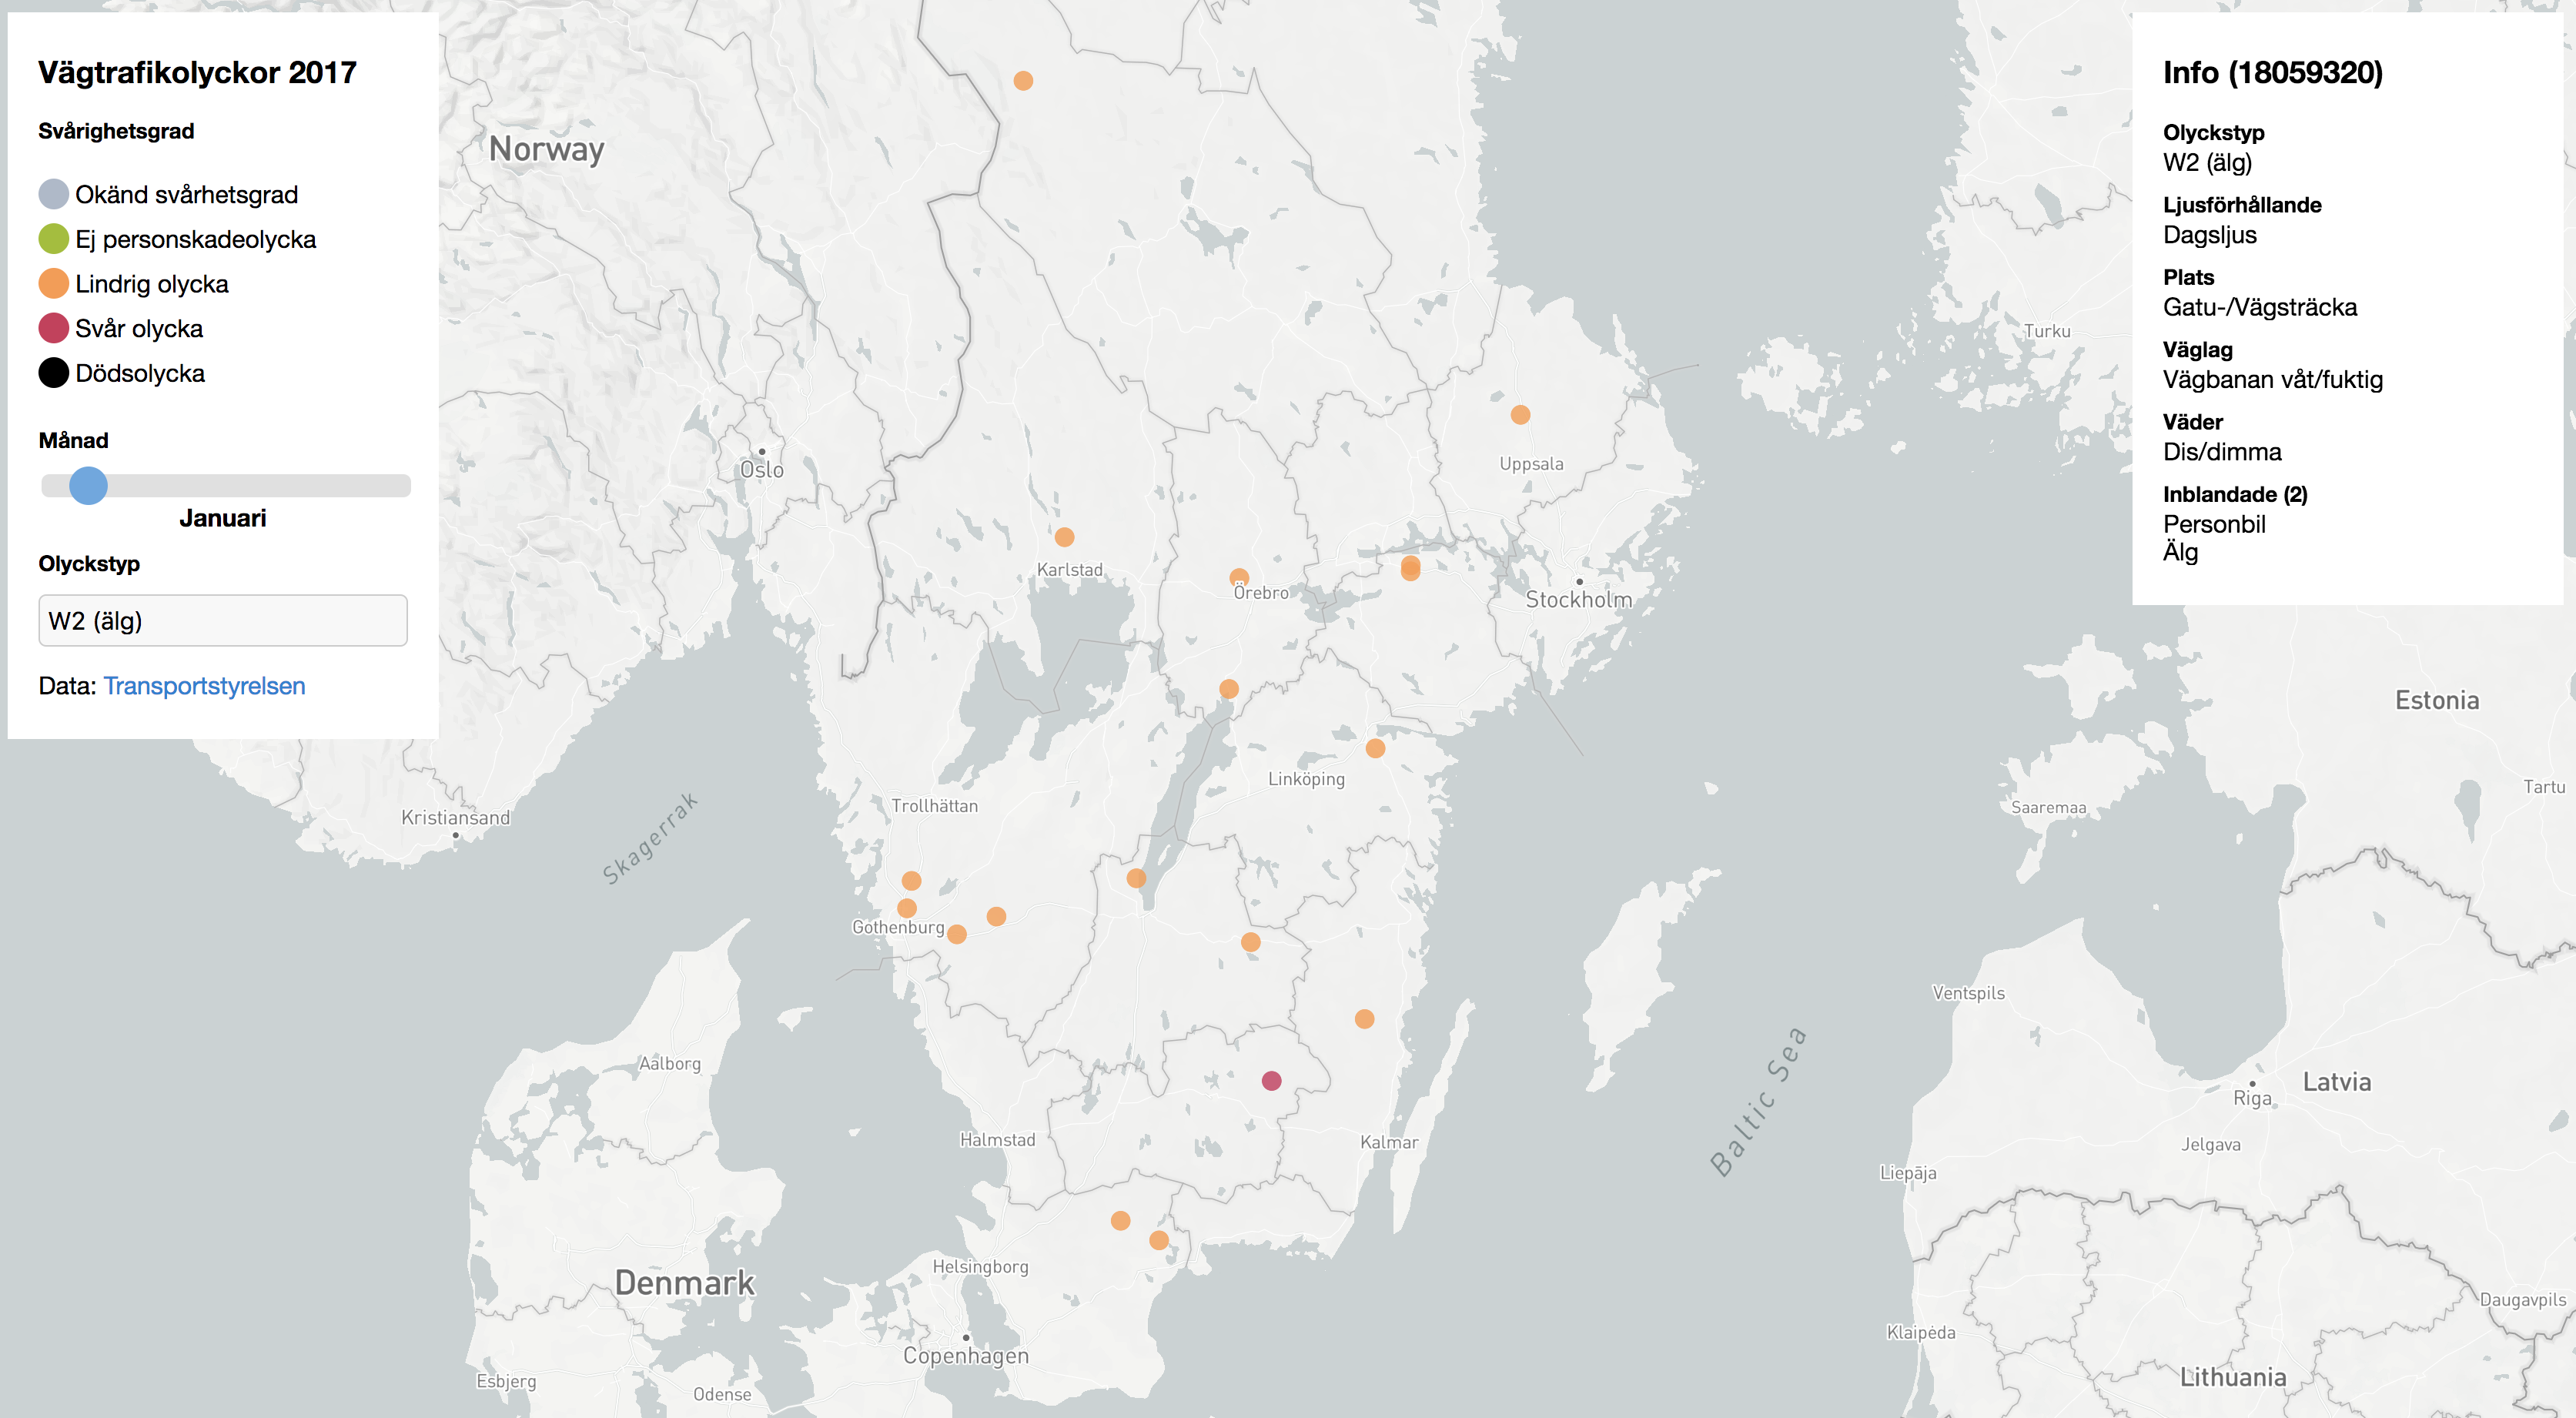
All moose accidents in lower Sweden during January 2017
Inspiration
The great zero vision in Sweden and interesting data from Transportstyrelsens API
What it does
It allows the user to overview all accidents in Sweden by year, type, month and severity.
The following questions and many more can be answered by our service map.
Where do most of the traffic accidents happen in Sweden? And is there a difference between years or months?
Where do most of the moose interrupt the flow of traffic, and where are bike accidents the most common?
How we built it
The service is built using Transportstyrelsens accidents API, a Python API and a web application.
Challenges we ran into
- Loading over 15000 map point in a decent time, fixed by separating API calls and decreasing data size
- Getting the map library (MapBox) to work in angular, ended up making it in plain javascript instead
Accomplishments that we're proud of
- We were able to optimize the loading time for our map
What we learned
- How simple it is to build API's in python using flask
What's next for How You Doin' Traffic
We want to add more filters, make a feature for predicting the likelihood of an accident in different areas and combining the data we got with more data sources. We've already been looking into data from SCB and made a graph showing how every municipality is improving in traffic accidents over time. Unfortunately, we did not have time to add it to our web application.


Log in or sign up for Devpost to join the conversation.