-

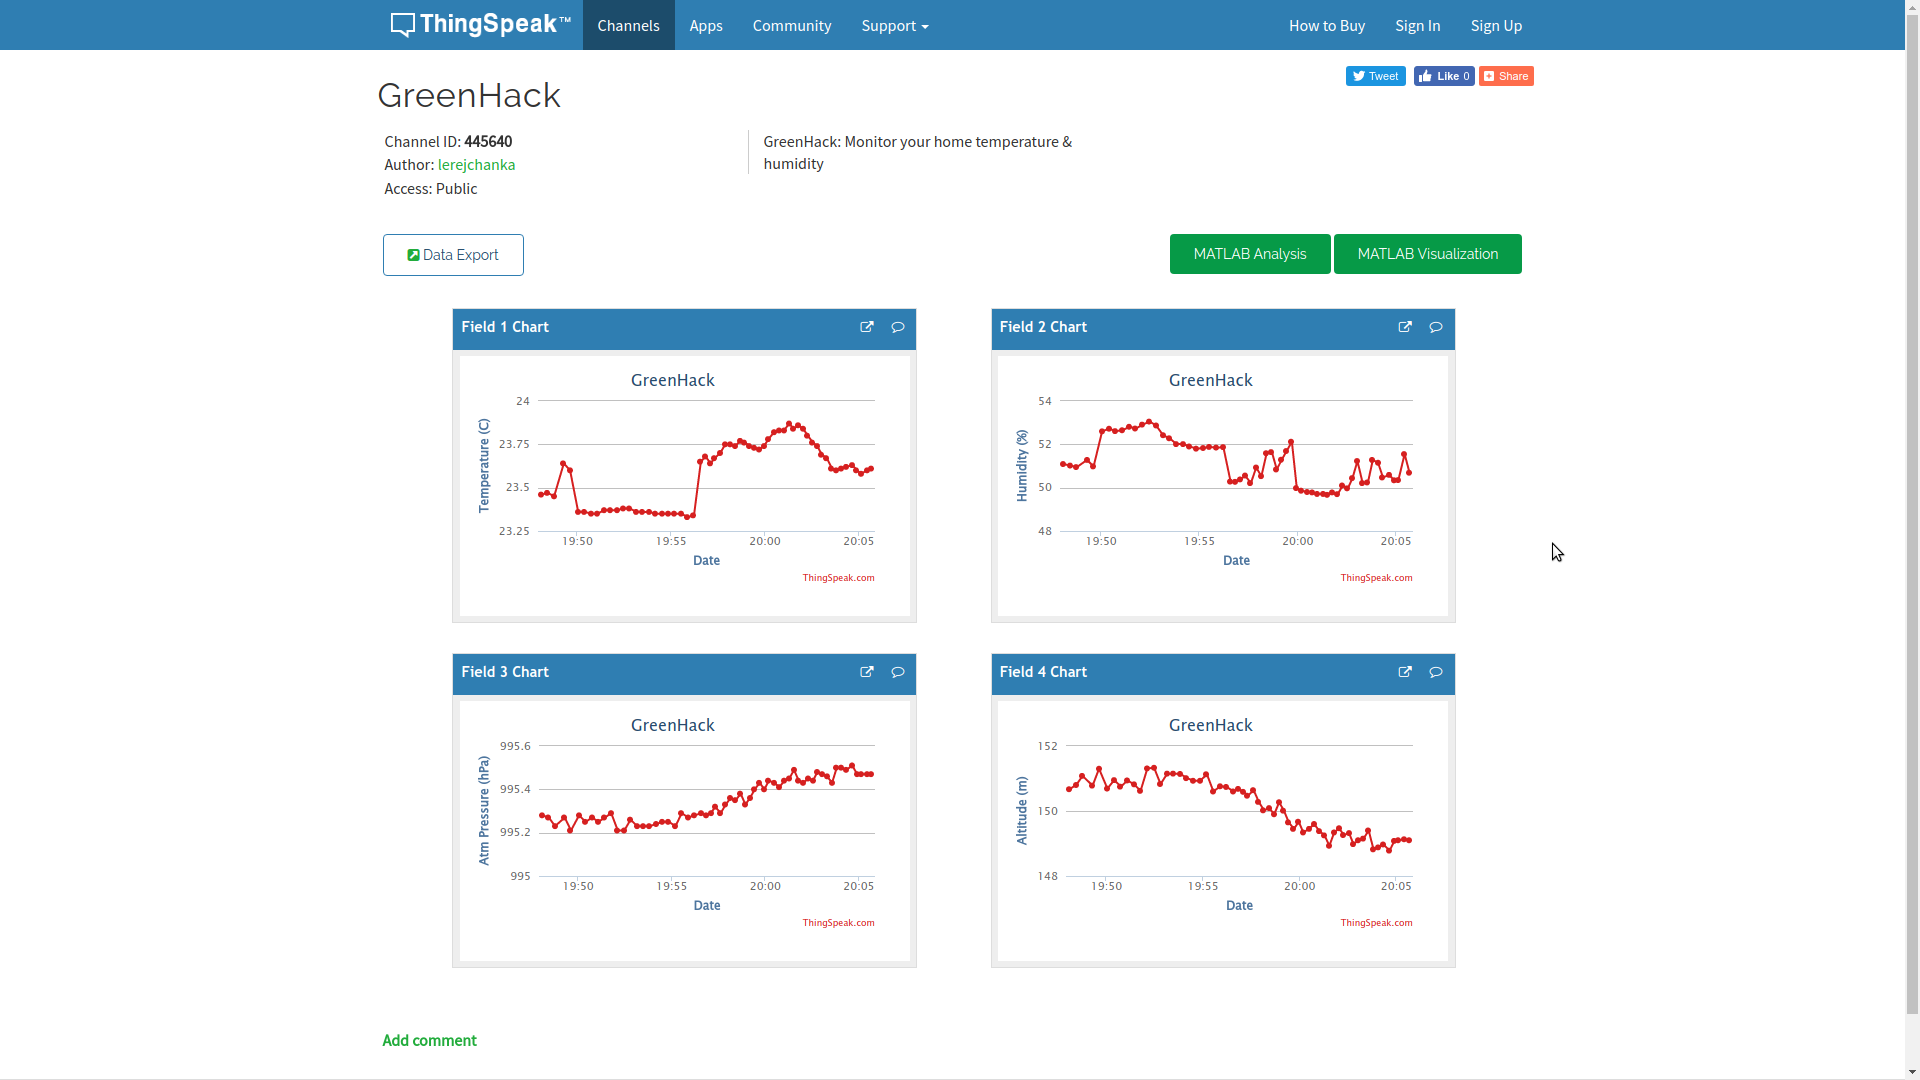
GreenHub's ThingSpeak dashboard
Location
Cluster 7B in the DPO.
Inspiration
We had a brief: to make "something that links to your household power consumption and displays the info in a creative way". The fruit of our labours is GreenHub.
What it does
The start of the journey is at the sensor device: every second, readings of temperature and pressure are taken. From this data we also work out the altitude, before sending it all off to ThingSpeak for storage.
At the other end, ThingSpeak produces dynamically updating graphs of all four parameters over time. The plan was to implement a webapp to wrap a dashboard around these graphs, but time was not on our side and this couldn't be done.
How we built it
The sensor device uses an Adafruit Feather M0 WiFi, with a BME280 environmental sensor. The data is sent to ThingSpeak (via a computer, see 'Challenges' below) using its REST API.
Challenges we ran into
- We wanted to use a library called
mpld3for data visualisation, but ran into a breaking code bug that hadn't been fixed. - The Feather M0 board was easily bricked, but there was thankfully a simple recovery procedure that came in handy multiple times!
- The plan was to use the onboard WiFi of the Feather M0, but local network availability was only 'eduroam', which isn't compatible with most IoT devices, including this one. As a stopgap, the data is transmitted over USB-serial to a computer, which then forwards the information on to the ThingSpeak API.
Accomplishments that we're proud of
We set ourselves a realistic goal, and managed to achieve it within the short timeframe available!
What we learned
- Sometimes library code is broken.
- Networking is hard.
- IoT is fun.
What's next for GreenHub
Implementation of the webapp, and maybe some more useful ways of interpreting the data available.

Log in or sign up for Devpost to join the conversation.