Inspiration
We knew that the majority of students creating projects or start-up ideas tend to solve problems they have experienced–something that faces them in their own demographic. However, if we are to make a revolutionary leap, we need a broader scope. As a team of both domestic and international students, we know that there exists a problem in the sector of business expansion. We understand that for global market expansion, insights into endemic labor force saturation, local competition, and employee growth rates are of great significance. It behooves investors if an analysis of such factors is readily accessible. In our project, we analyzed the Company Insight Data and generalized several factors that may provide international opportunities for corporate expansion or overseas investments. Specifically, we wanted to work on the expansion of the medical devices industry in struggling countries where there is potential for growth or a great need for humanity.
Project Use Cases (Buisness-to-Business Model):
- Start-up company in need of ideas,
- Existing large companies seeking expansion opportunities,
- Struggling global/international markets with both humanitarian and financial growth points, and
- Businesses interested in tracking the IP of their current products.
How we built it
Problem Definition
We first define the problem our project should solve, which is to create an easily accessible web application for possible market expansion and/or global investment opportunities. Then we analyze the components we need for the web page and how we should process the PDL data for our software to present.
Data Selection
In this part, we determine what data we use for the project, and we decide on the Company Insight Data. It is acknowledged that we need a statistically significant amount of data to present a feasible outcome, but due to limited access to the data, we sample some of the industry categories as a demo case. Our sample is for the medical device industry. After choosing the sample we did query for data and exported into csv formats. Later we created our SQL with these sampled data and connect with our software.
Data Cleaning
In order to clean the data, we did an in-dept analysis of the given fields and how these could be significant in our insights. This process began first with looking into the duplicated fields. Here it was identified that the 3 billion data-points from the People Insight data actually reduced down to nearly one billion unique individuals. Looking into the formatting of specific fields, we altered data types, implemented regex, and pivot tables and merges to flatten nested dictionaries. Additionally, going through these data complications, we identified a significant discrepancy in the raw people data labs dataset which led to key errors in our interface. After augmenting and imputing for missing values, we were able to create significant data metrics for our market analysis. Finally, we exported cleaned datasets with our newly augmented and merged metrics in addition to an externally collected dataset utilized to enrich our current People Data Labs dataframe.
Software Aspect
- Search Box
- Search keywords for company/industry and pass the input words for data fetching
- Query Result Page
- Growth predictions
- Market size analysis
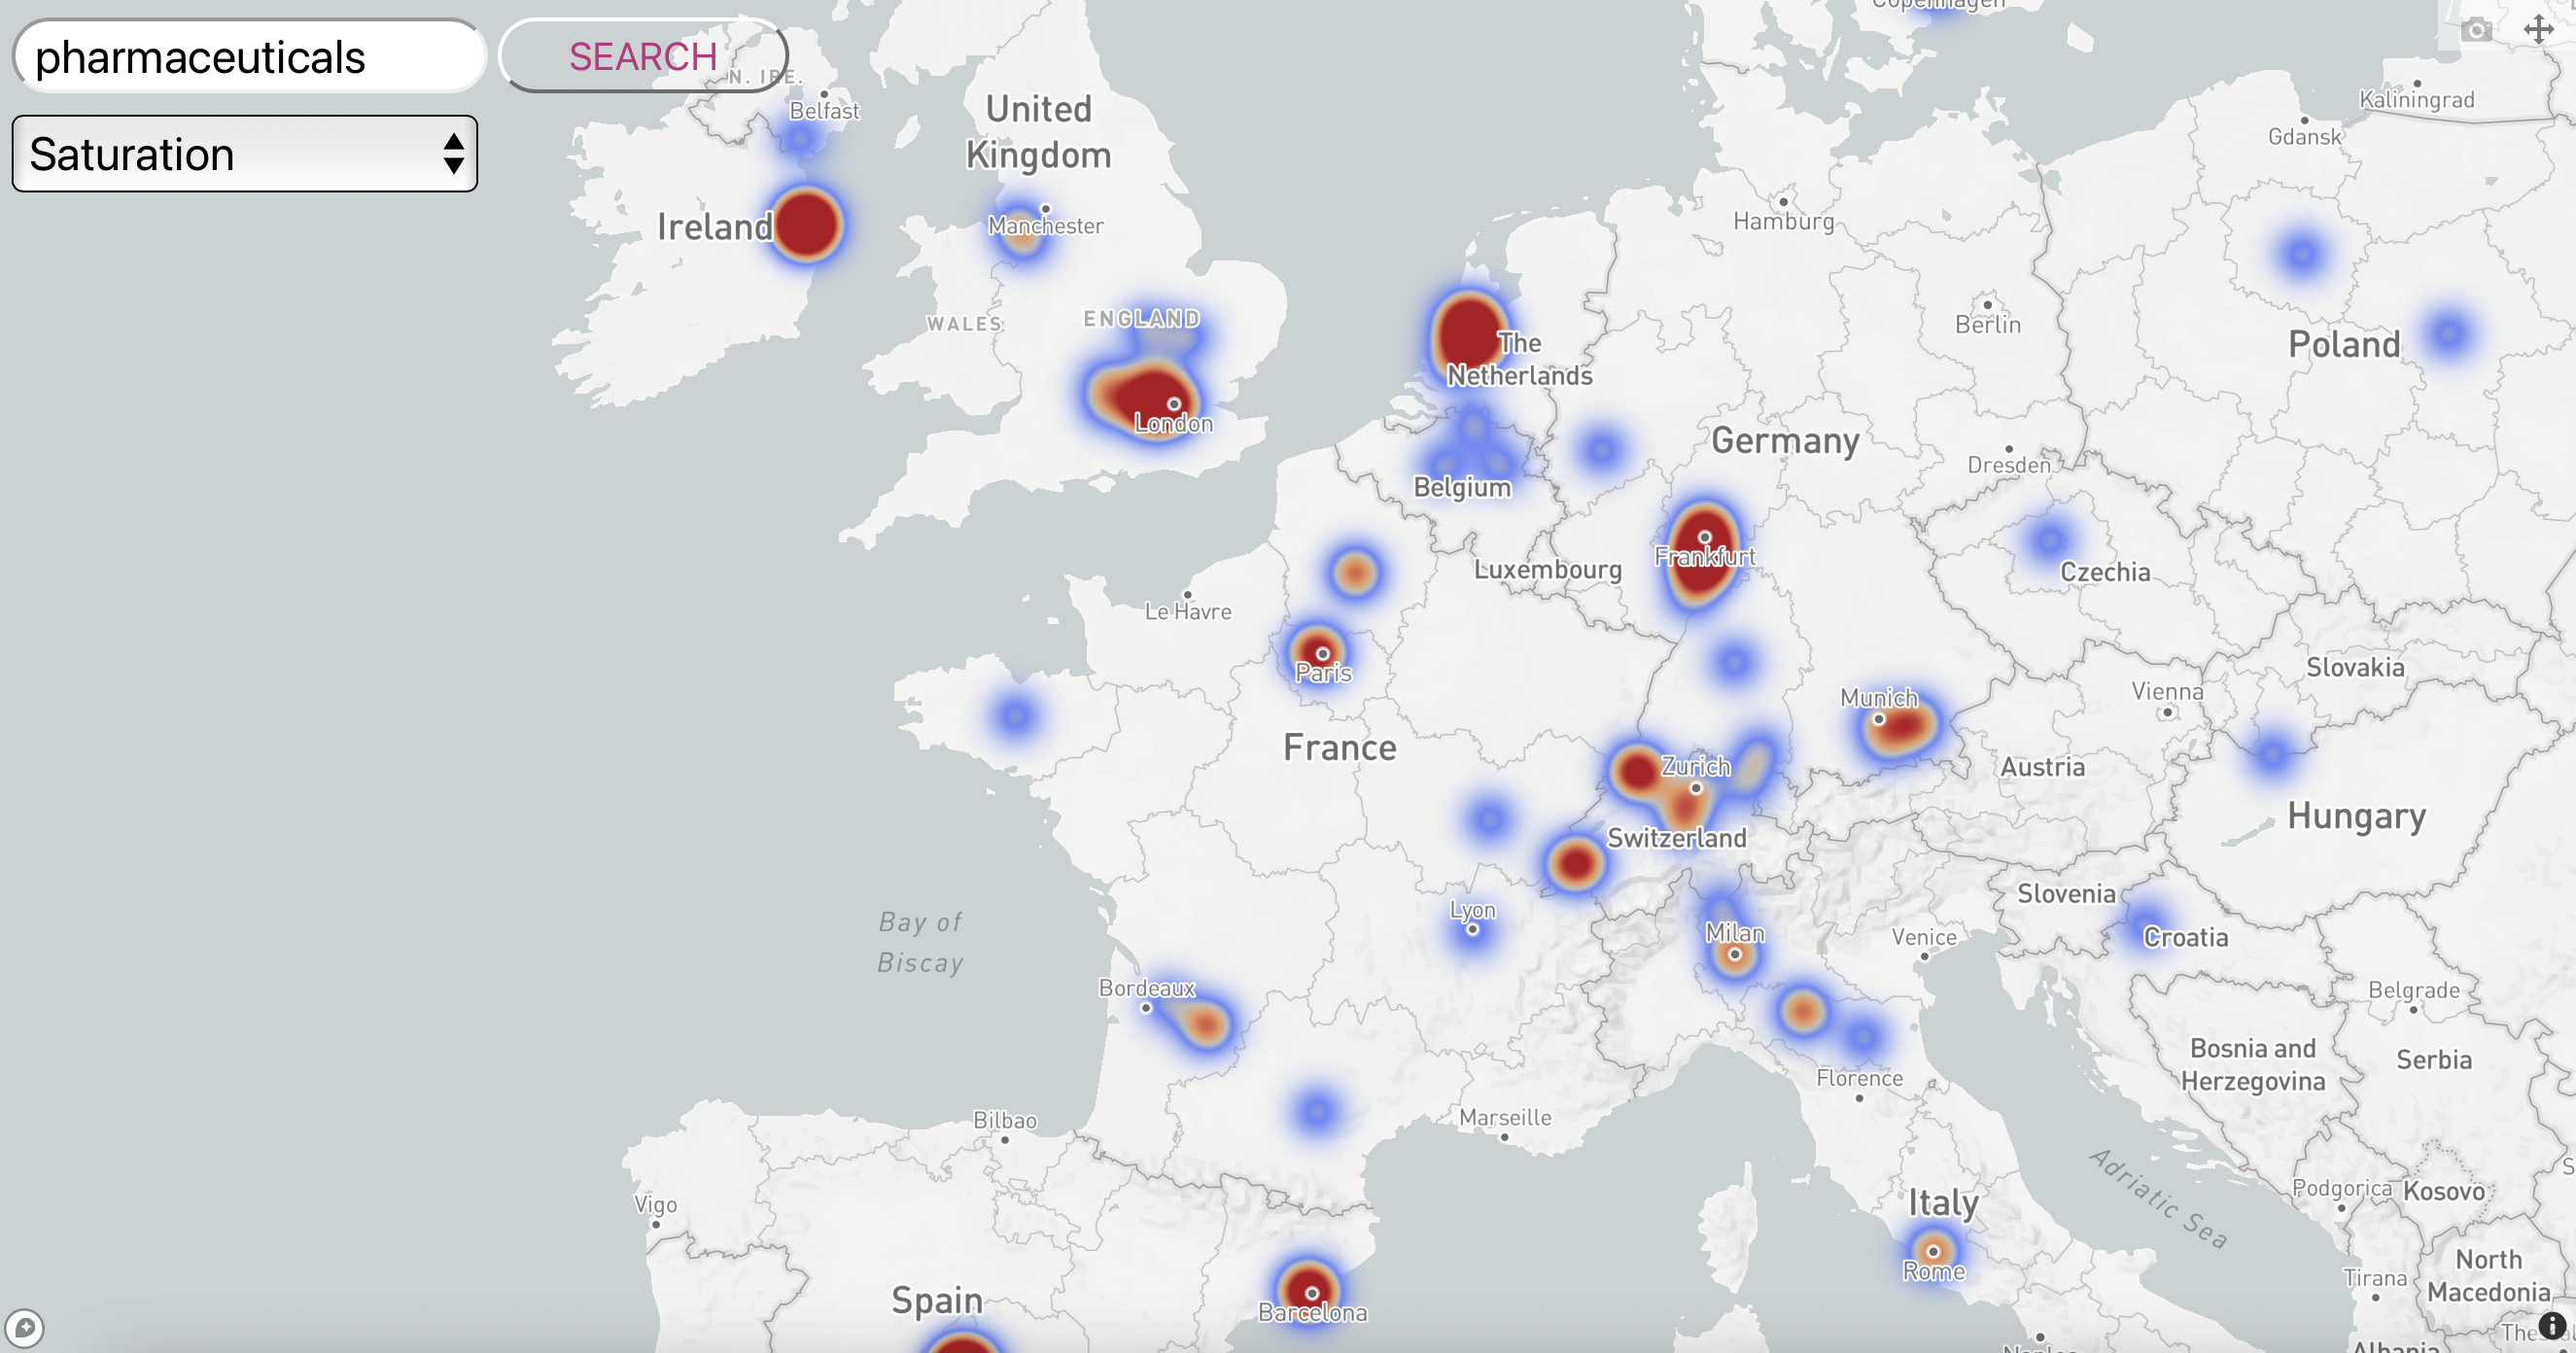
- Regional markets Saturation Identification
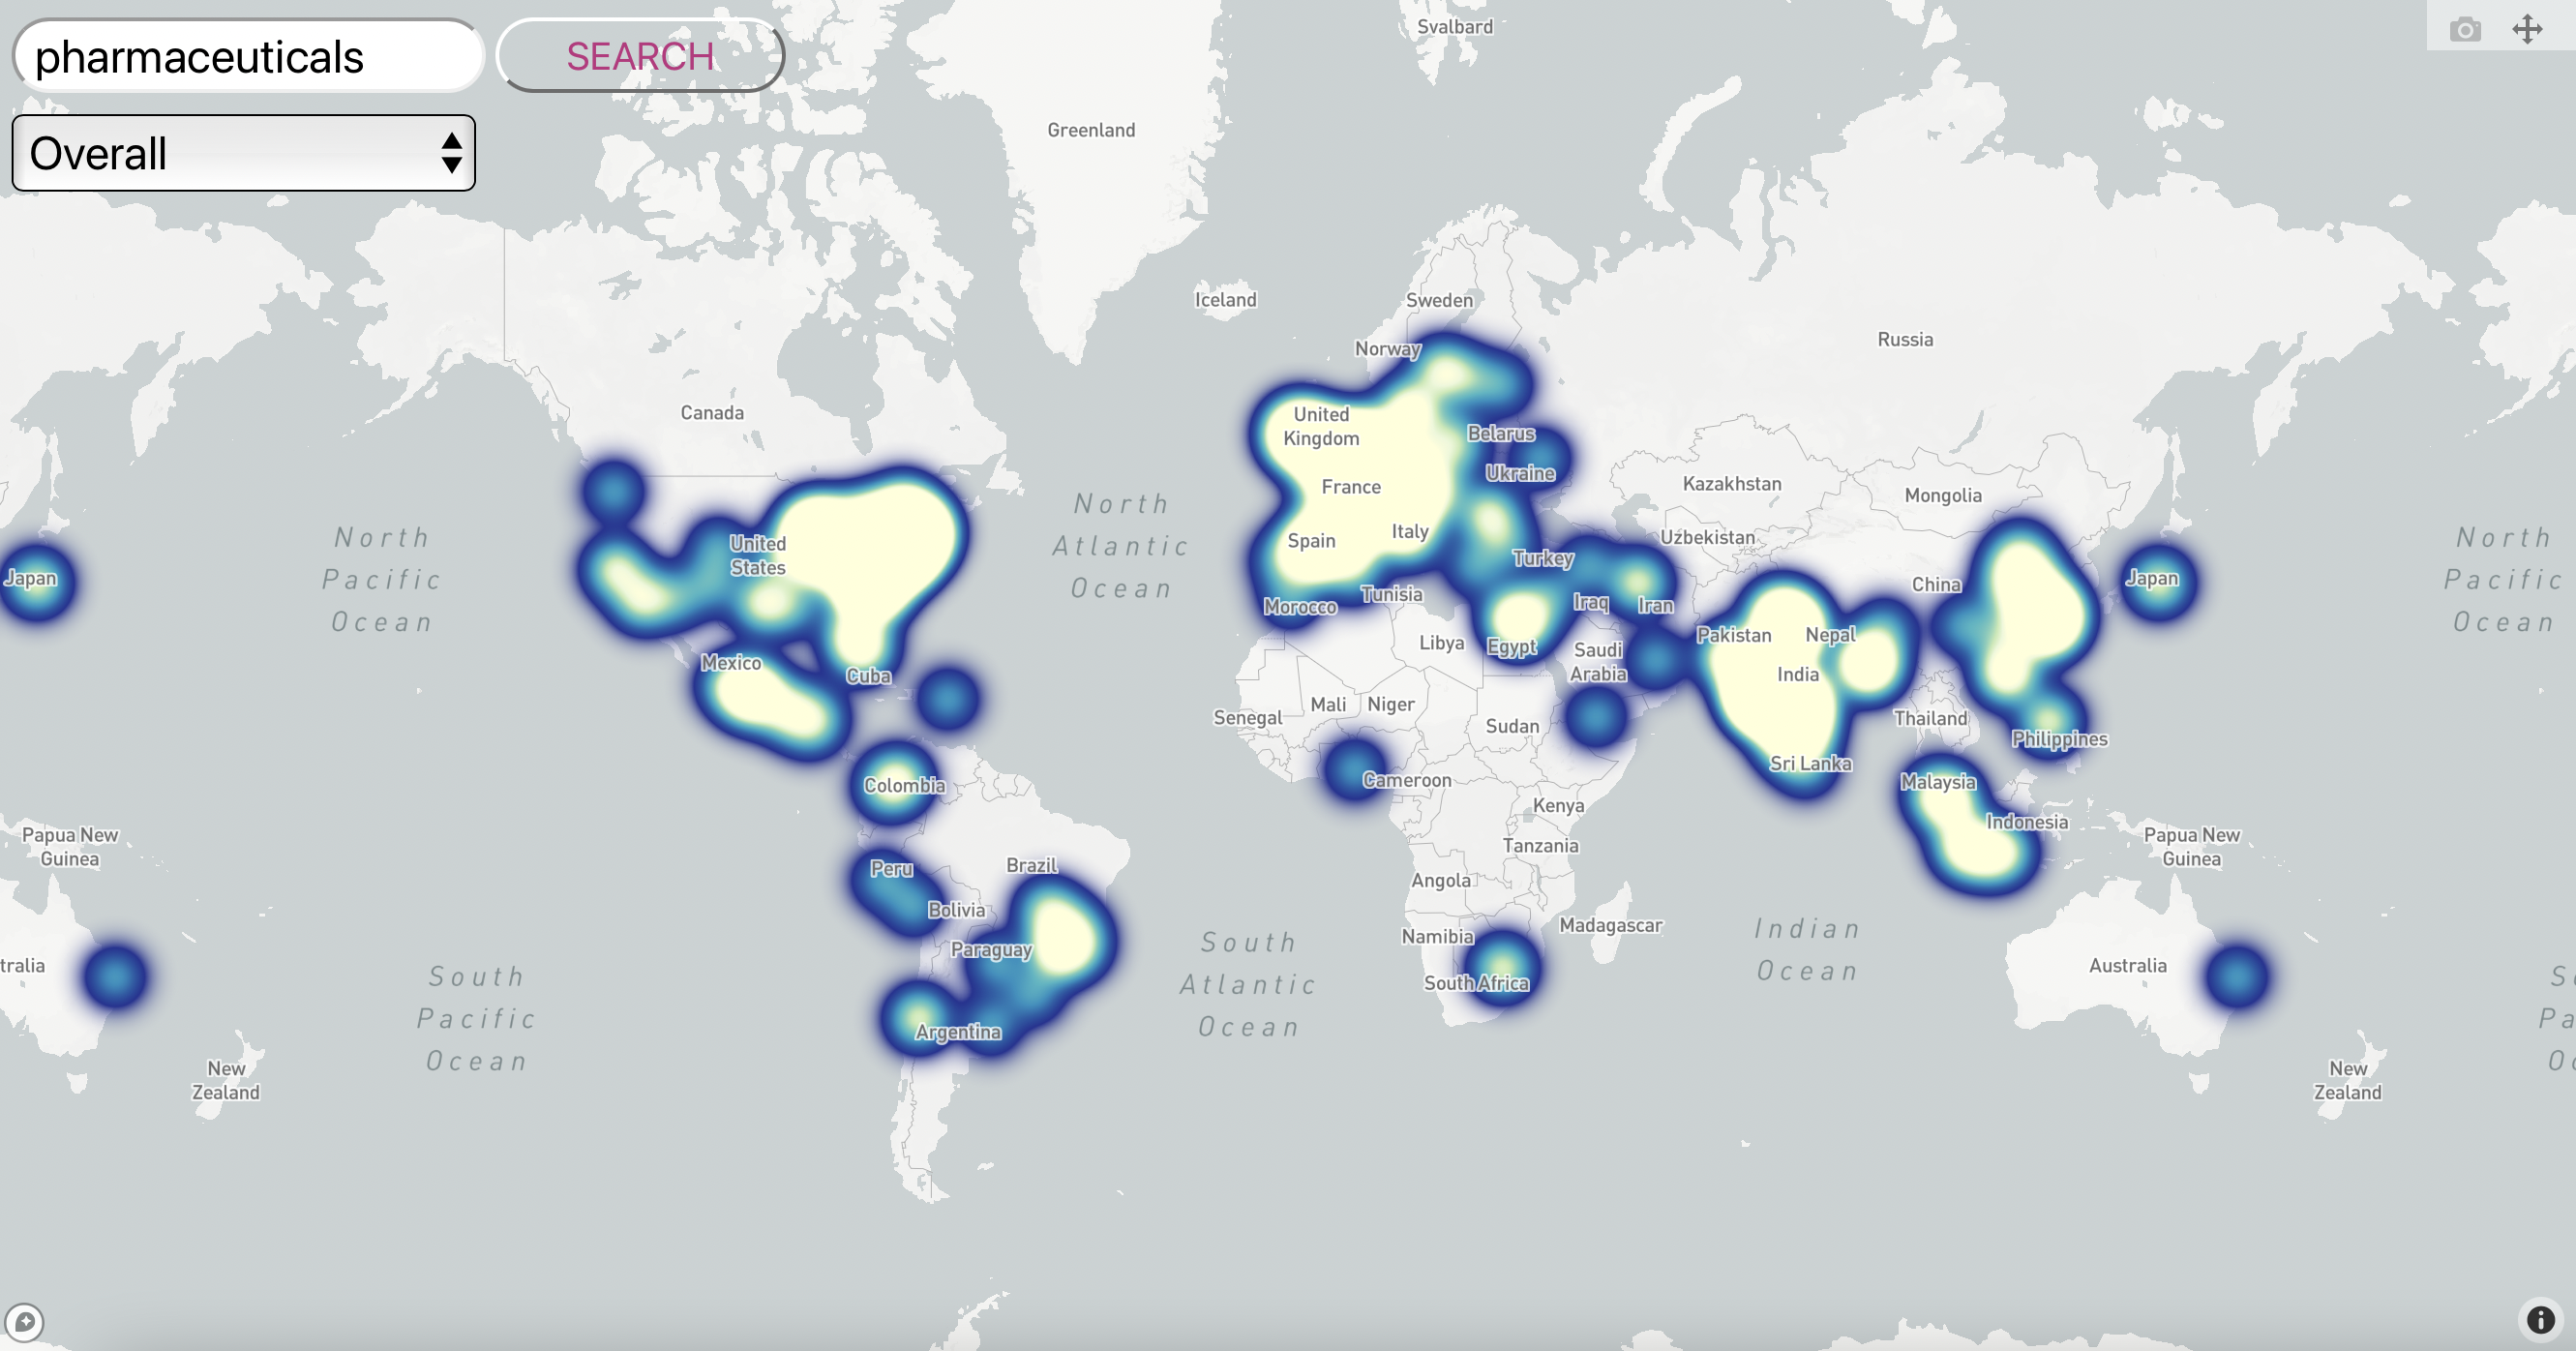
- Global markets Existence
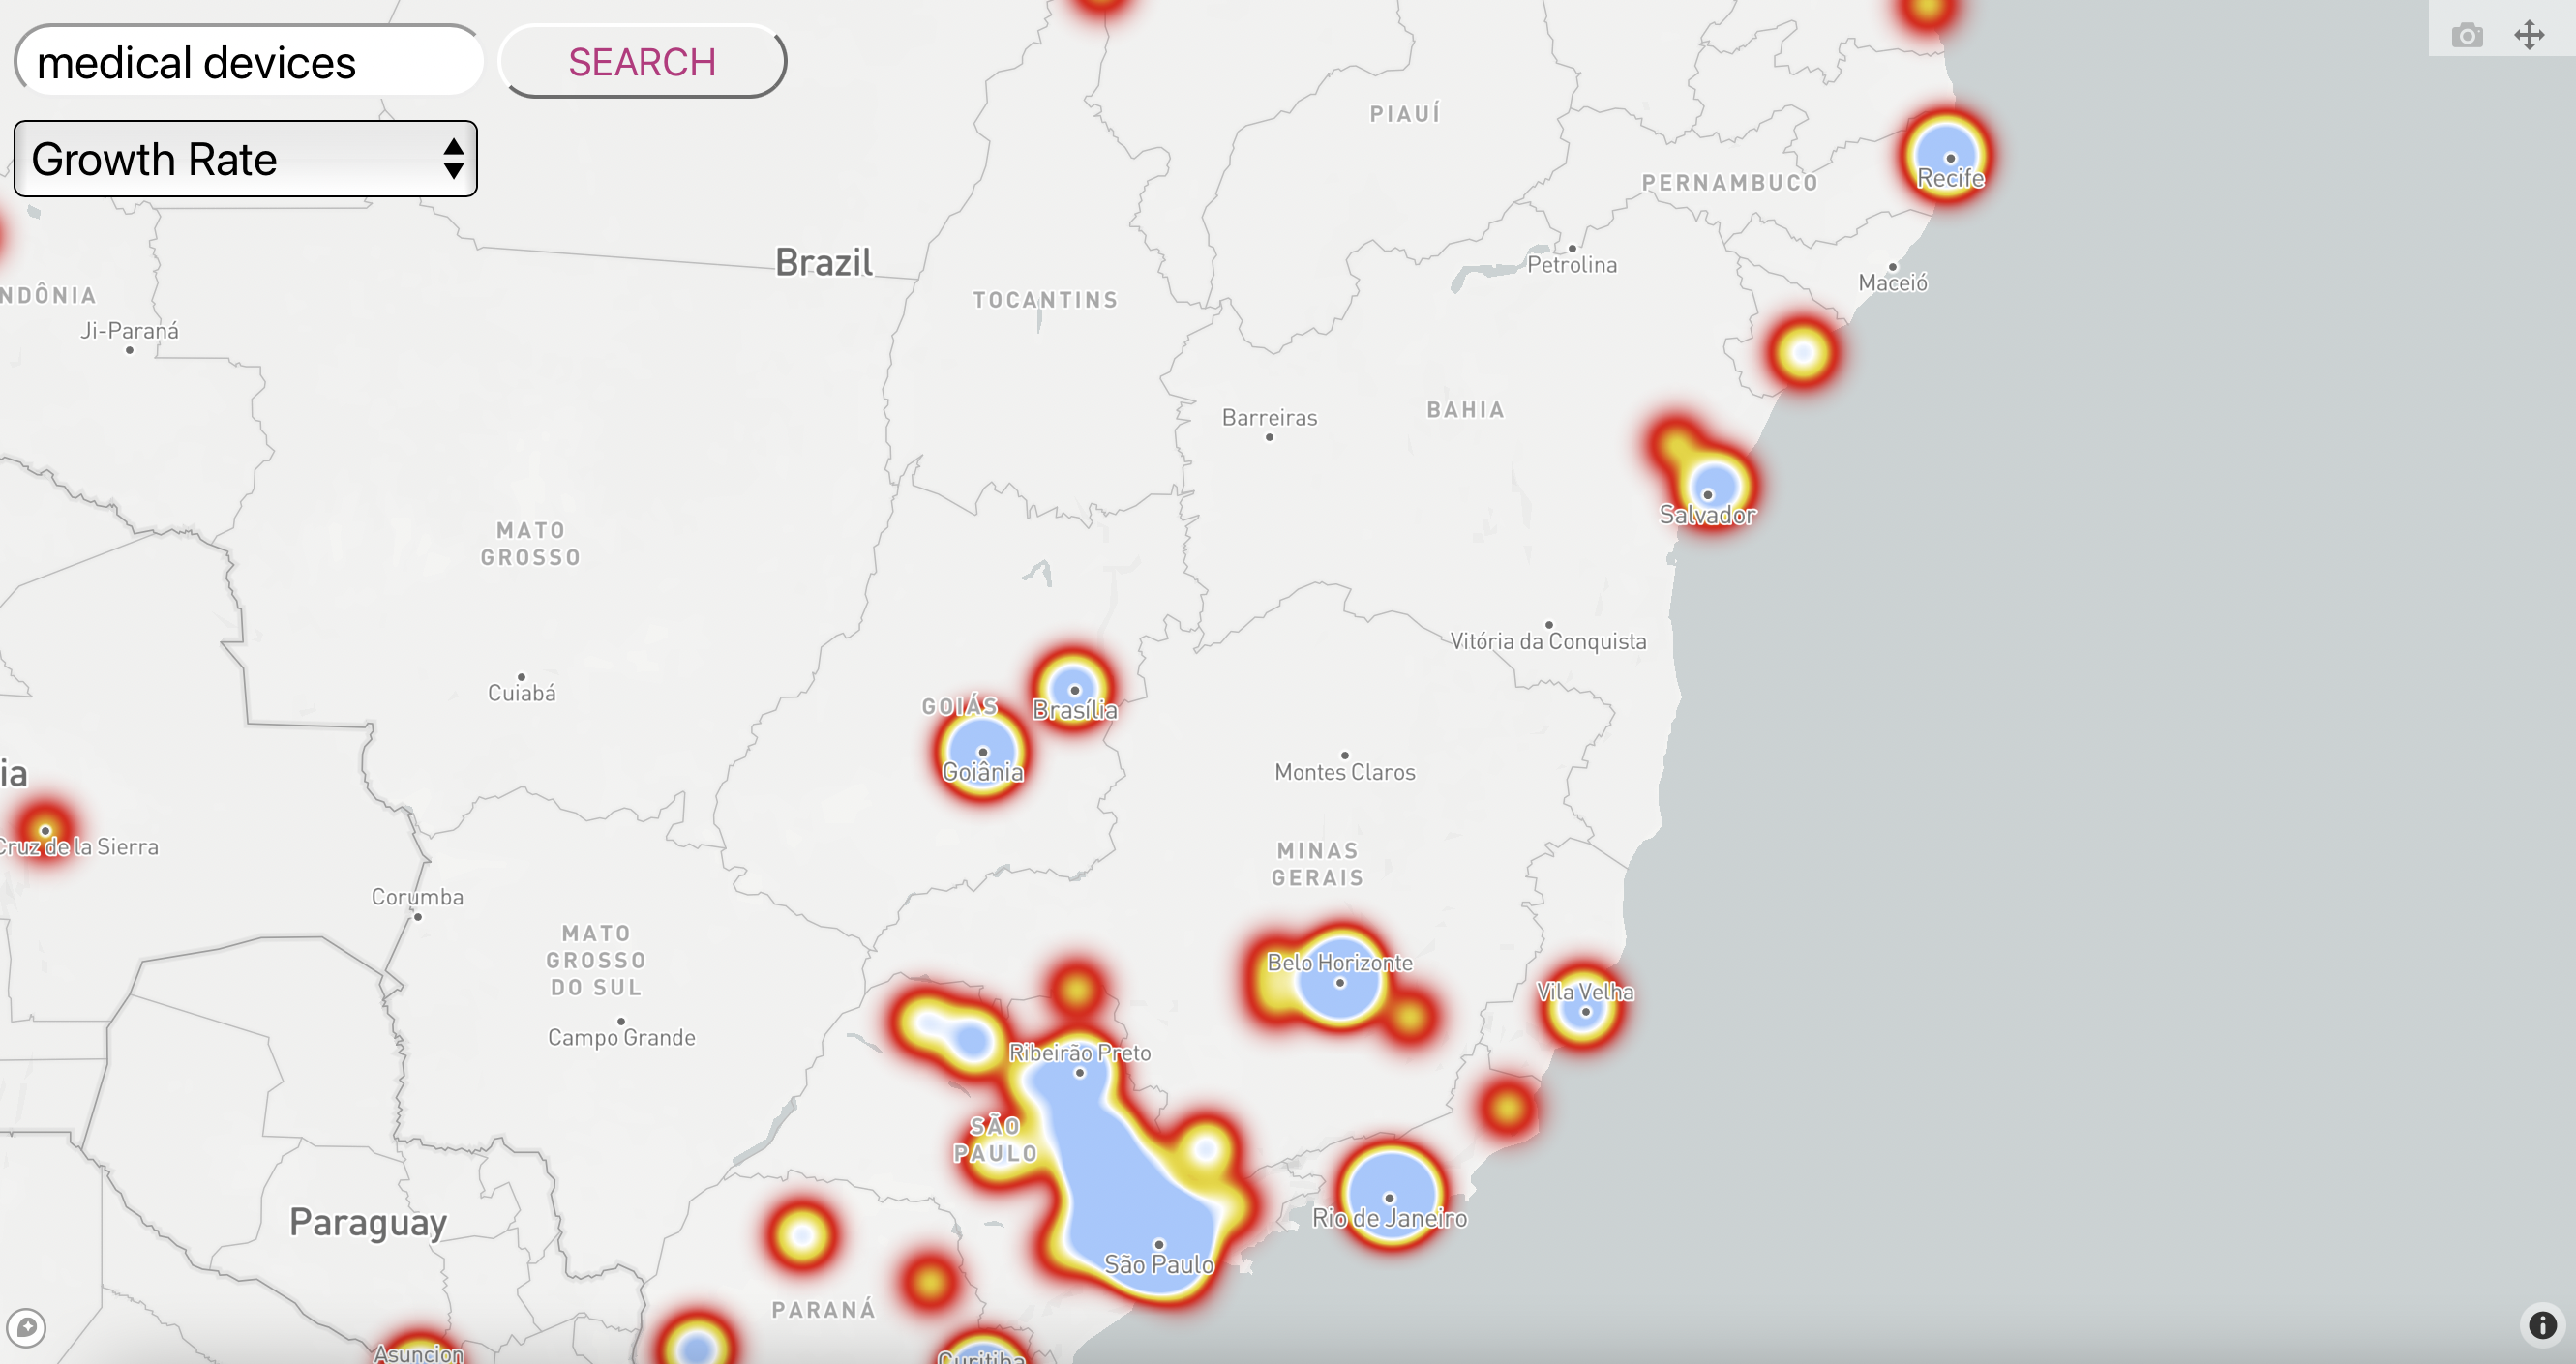
- Overall business opportunity number/statistics table we get from our insights (example: “The something market is currently 76% saturated, domestically and 23% saturated internationally. The something region has a ___% engineers need for industry. We rank this market opportunity a 78% positive towards market expansion.”)
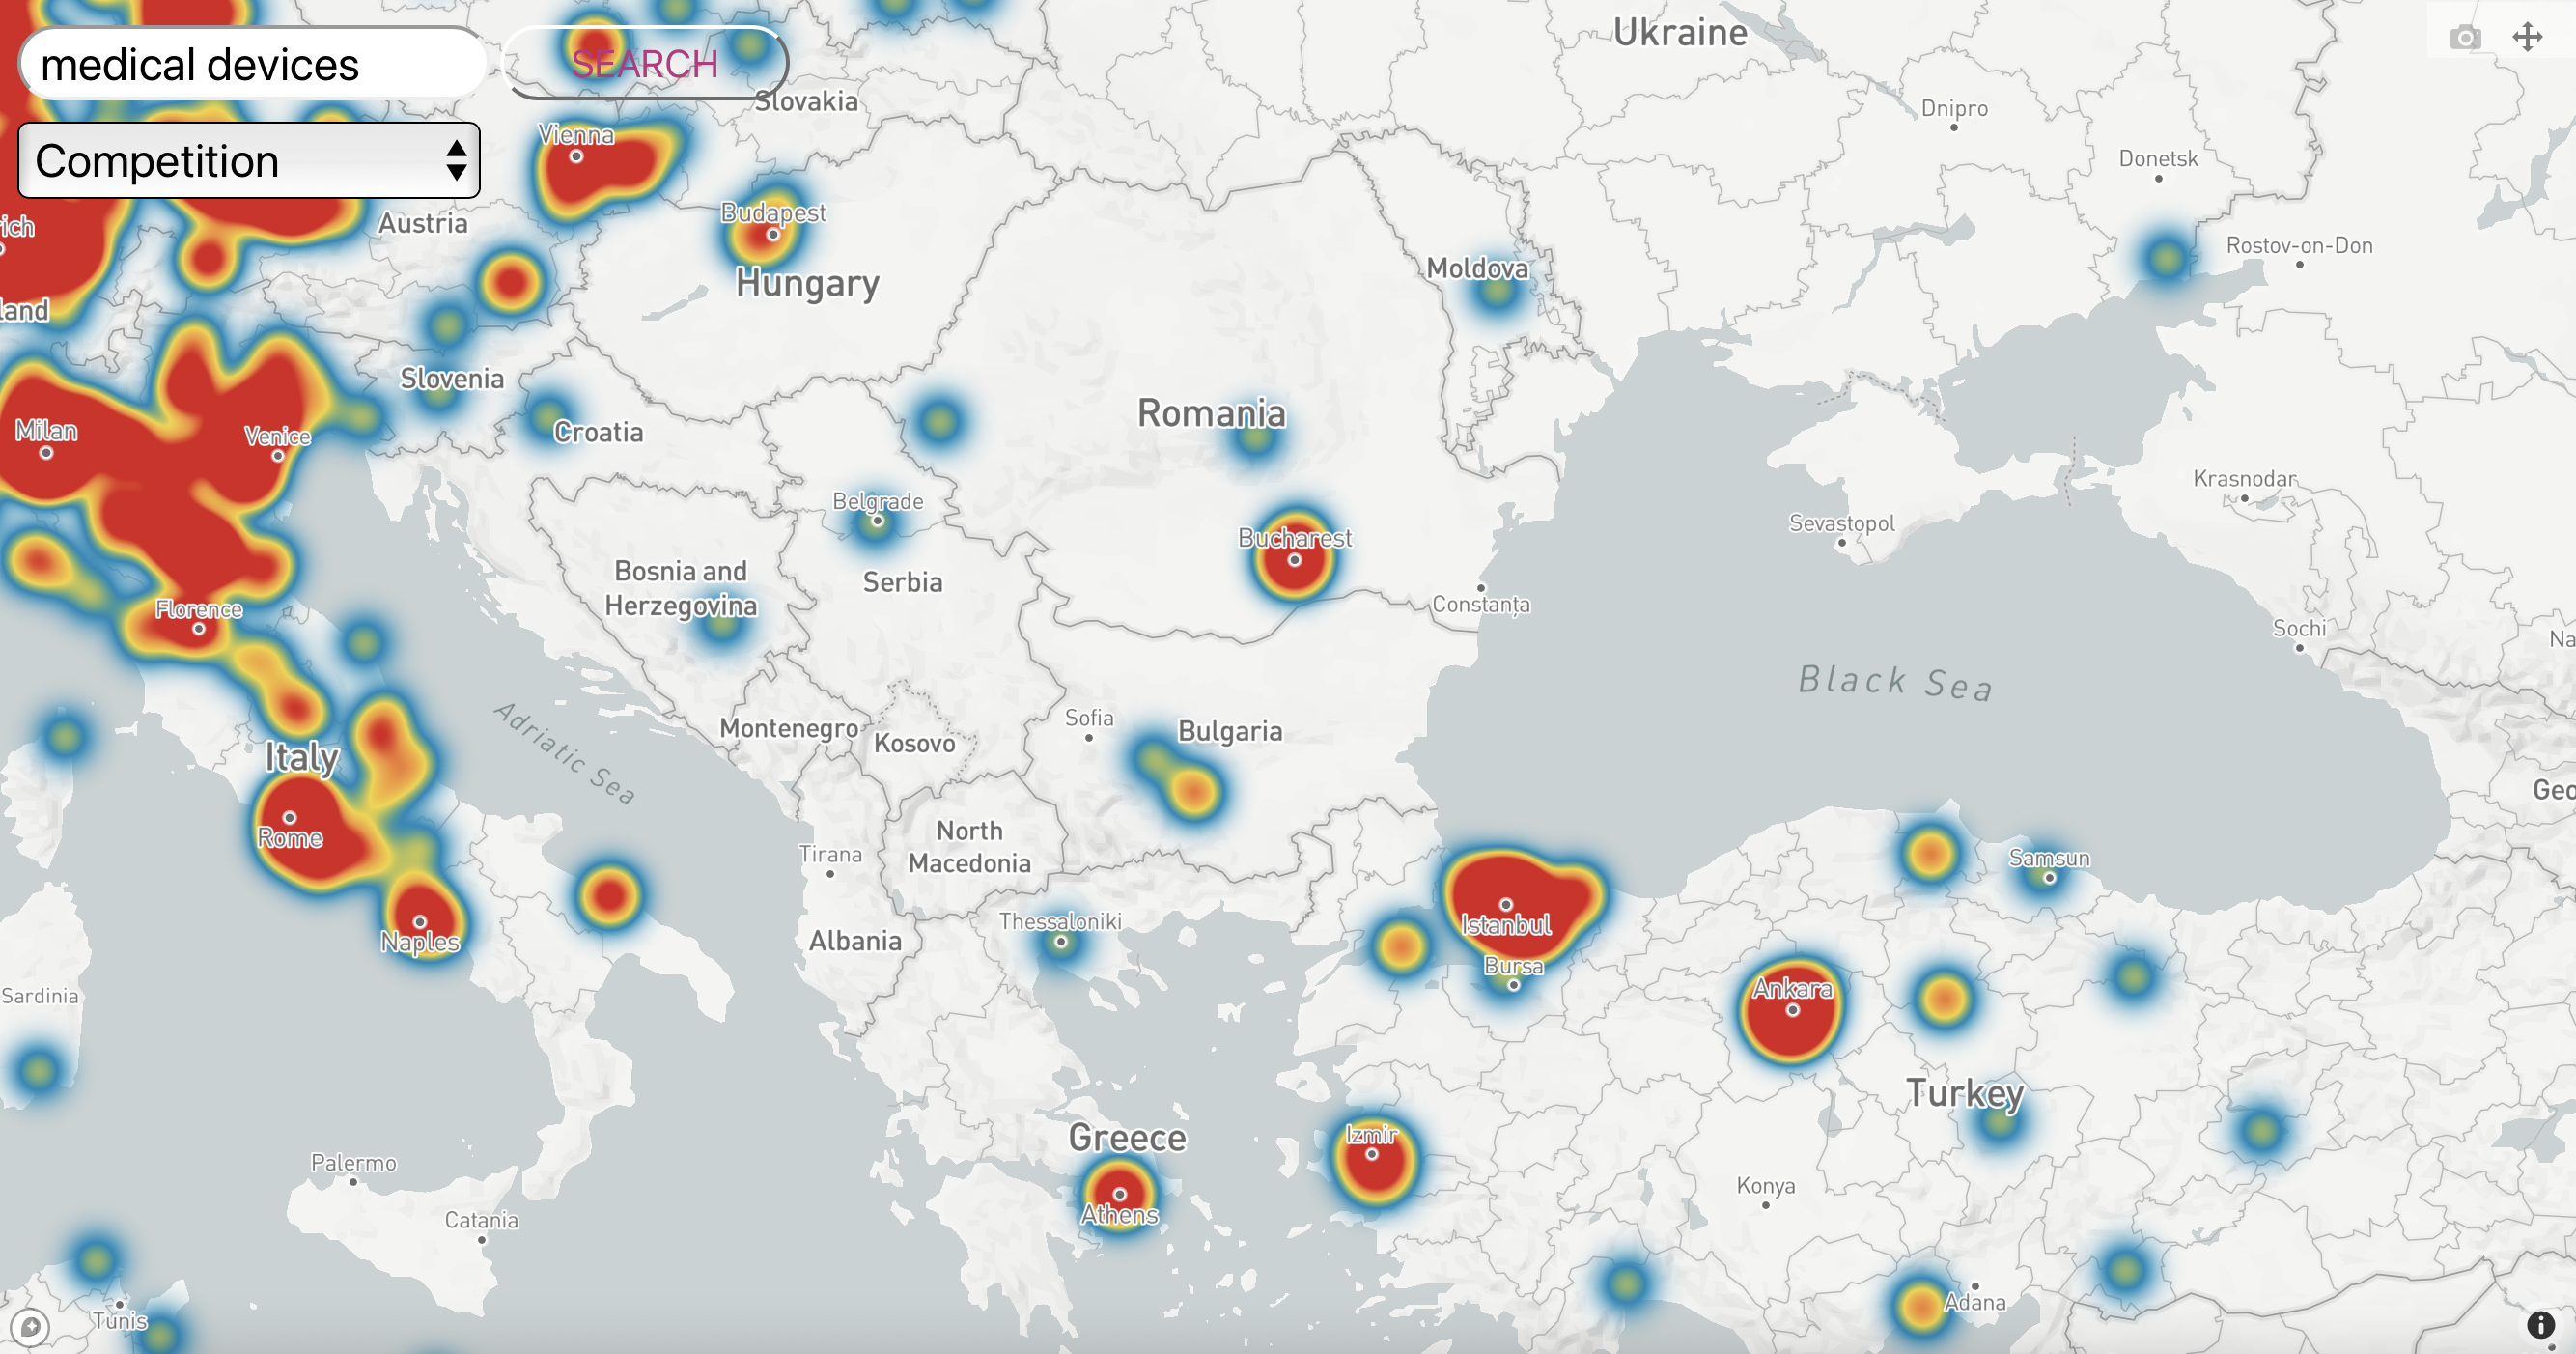
- Heat map visualization of the international market, where it not only identifies specific countries but also regions to find correlations between countries (i.e. Eastern Europe presents a good opportunity for energy production due to limited competition and large amounts of capital)
Challenges we ran into
Data
- The dataset is missing about 2000 data points in overall location.
- The dataset is missing additional 2000 data points in specific lat and lon location.
- The naics column is misformatted in raw data pull, sometimes the null column is listed as None, ‘None’, sometimes the column does not exist, and sometimes the columns listed are out of order. ### Software
- We need to implement our own APIs.
- We need to create accessible functionalities to present the data in an understandable way.
- We need to parse the data and plot it on an interactive map. ## Accomplishments that we're proud of
- We designed a full end-toend user interface for the demostration.
- We figured out the flaws of the data and did the best we could to sanitize the data. ## What we learned
What's next for Global Industry Market Analytics
During the project formation, we realized that we can take the following steps to improve the project.
- Data Augmentation
- Add additional company data
- Add the people/potential employees in the region, based on that specific company or industry's need for employees to determine if there are already employees in that sector that need it
- Incorporate Market predictions with Crunchbase or Stock trends from Yahoo Finance or Google Search trend analytics in addition to the current PDL dataset
- Search queries
- Add advanced search queries which address the problems we lined out ealier
- Look into the accuracy of employee count


Log in or sign up for Devpost to join the conversation.