-
-
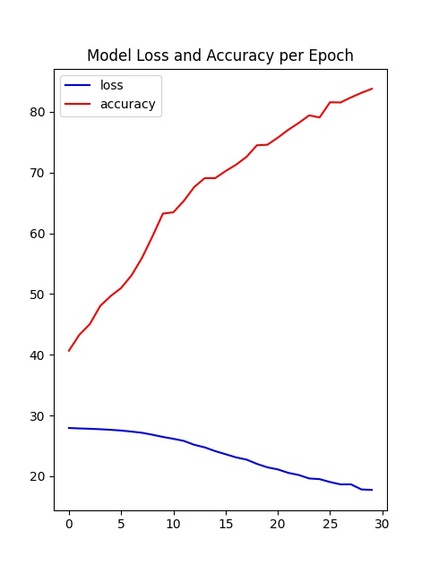
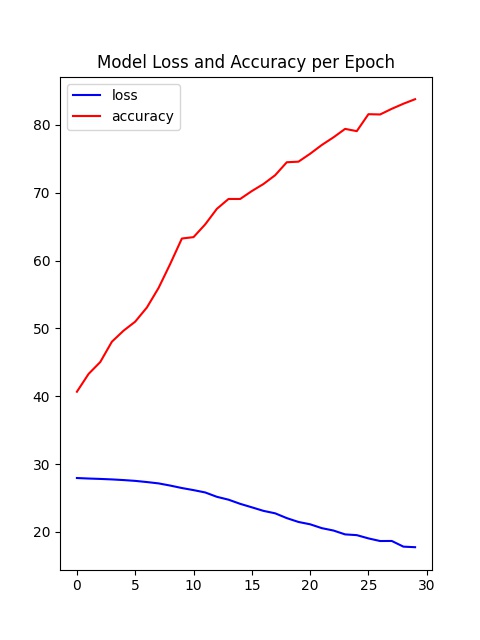
Graph for training model that shows decreasing loss and increasing accuracy as we train the model.
-

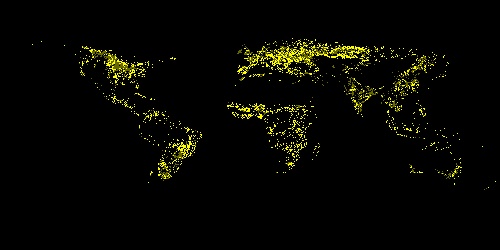
GFSAD1000 dataset - yellow datapoint represents the area that crops are growing
-
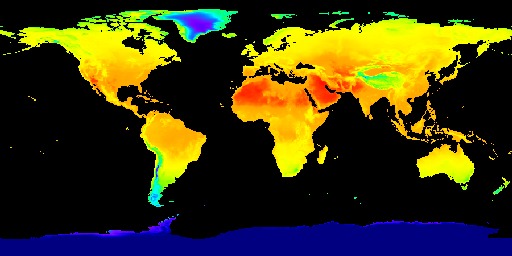
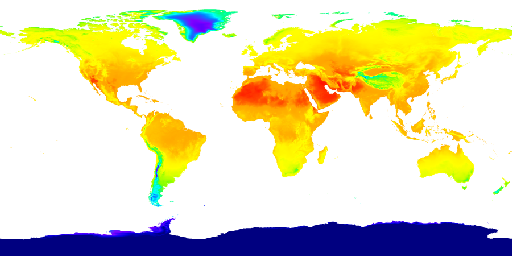
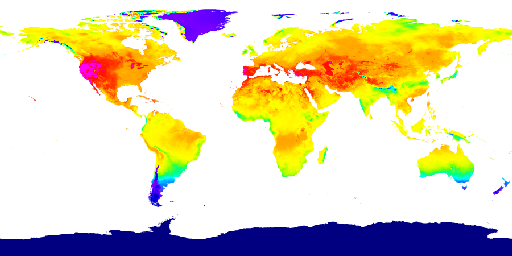
ERA5-Land dataset heat map about Temperature 2m above ground
-
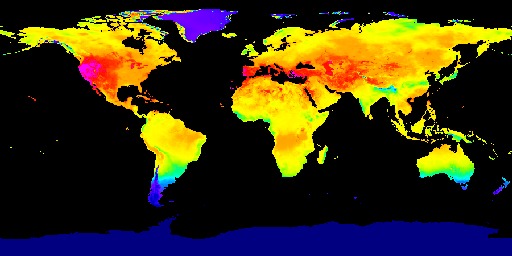
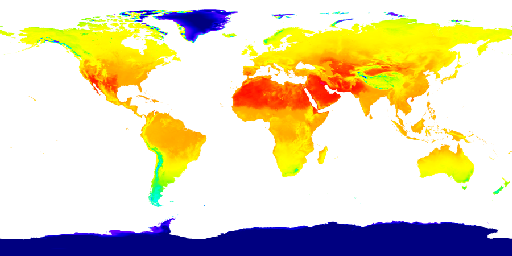
ERA5-Land dataset heat map about Solar Radiation
-
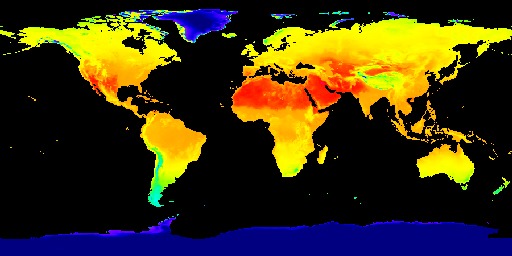
ERA5-Land dataset heat map about Soil Temperature
-
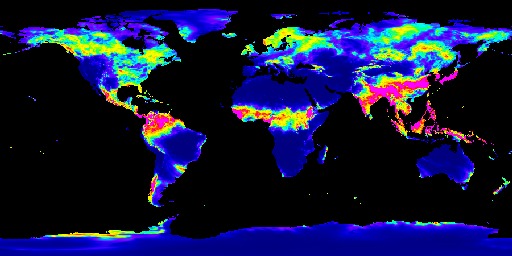
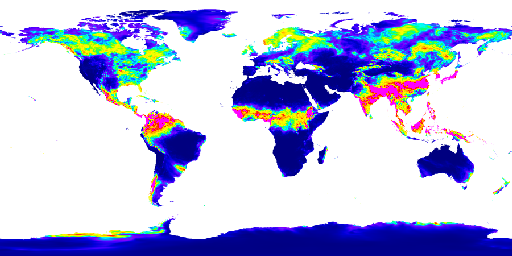
ERA5-Land dataset heat map about Precipitation
Inspiration
As the global population increases, the demand for food is higher than ever while the food supply by farmers remain relatively constant. To solve this, we must find the most efficient way to utilize the given resources. There are numerous factors that affect farming such as seed, chemical, and labor, but we believe that the most important aspect of all is the land we farm in. There is a lot unutilized land that can. be converted into farmland, which can be converted into agricultural area to feed millions of people who are suffering from hunger. Countries which are underdeveloped can benefit by finding land that can be used to grow food for their communities. Acknowledging the severity of this situation, we aimed to build a creative solution that would find viable land that people could use to produce crop to increase food security. Additionally, when a single crop is planted in the same place every year, the soil structure slowly deteriorates as the same nutrients are used time and time again. After a few years, the soil becomes unhealthy, drained of those specific nutrients. By finding more land we can slowdown the process of farm land destruction. By this, we want to help people in hardships in the global community and promote sustainability by providing more land to farm in and not overwork the land.
What it does
The user can access a website in which there is a global map overlaid with grids. The user can zoom in anywhere in the world and select a specific region. After the user selects the region, the machine learning model is run to decide whether or not that area of land can be used for farming.
How we built it
Our project has two main component, the website and the machine learning algorithm. For machine learning, we first collected data from the Google Earth Engine, which is a a planetary-scale platform for Earth science data & analysis. Among the many datasets it provides, we used the ERA5-Land dataset and the GFSAD1000 dataset. The ERA5-Land dataset provides us four global heat maps the each contains information on temperature, soil temperature, precipitation, and solar radiation. We use these heat maps to crop out a 400 kilometers squared area in a certain position on the globe for every map and form the feature vectors for that area using color encoding. We used 3000 randomly selected regions around the globe for this project. The GFSAD1000 dataset provided us a global map where the places that crop grows in is marked in yellow. We used this data to form a label which tells us if the region we generated feature vectors for are growing crops or not. Using the feature vector and the label, we performed a binary classification task using the model we built using pytorch. The model is consisted of two one dimensional convolutional layers and three dense layers containing different numbers of nodes. We then trained the model and adjust the parameters like epoch, learning rate, and weight decay to achieve the optimal training process. After we checked that the accuracy and loss graphs per epoch are smooth curves, we predicted results for our test data (which we allocated randomly 20% of the total dataset) and achieved about 82~87% accuracy for it. Finally, we visualized the loss and accuracy curve using matplotlib.
Building the frontend of the website was a very involved process. After consulting with one of the mentor's from John Deere who had experience in map data he told us that Google maps used a tiling system to segment regions, which would be a perfect fit for our model (tiling example here: https://developers.google.com/maps/documentation/javascript/coordinates). So, I implemented the tile system over the map that is able to read the latitude and longitude values of two corners of the tile that the user selected. This information is then sent to the backend where it downloads geospatial data on that specific region and runs it through the model. The area is then highlighted based on whether or not the model thinks crops can grow there. Green means that the model thinks crops can grow in that area, and red means that it does not think crops can grow there. The square image that is outputted is representative of the tile that was selected by the user.
Challenges we ran into
The biggest challenge we faced while developing our deep learning algorithm was collecting data and preprocessing it. Our goal was to find data that incorporates the information crucial for farming such as temperature, precipitation, soil temperature, and solar radiation for the whole globe. We had to invest a lot of time to find the appropriate data, but eventually, we found the Google Earth Engine. We faced another challenge while we were training our deep learning model. Our goal was to smoothly decrease the loss function without the values fluctuating while training the model. However, when we were first training the model, the loss value rapidly decreased in the first few epochs, then remained constant or fluctuated. To solve this problem, we first tried to overfit the model by increasing nodes to verify that the model is trainable with our data. After we checked that it works, we adjusted values such as epochs, learning rate, and weight decay to find the optimal condition to train the model. Then, we used scalers to scale the value, and most importantly we used convolutional layers to better analyze the feature vectors. After these processes, we saw that the loss smoothly decreased and accuracy also consistently increased to achieve about 87% on average, which proved that we prevented overfitting and we were training the model meaningfully using the feature vectors.
Accomplishments that we're proud of
We are proud that we were able to make a model that accurately predicts if the land is viable for crops. Additionally, we were able to implement a map selection tool where users can easily select specific regions to check if crops can be grown there.
What we learned
The experience in participating in this track provided us the unique experience to explore the environment and agricultural data that we do not usually see in our daily lives. Thinking of ways to analyze new data taught us how to handle various types of situations. By overcoming failures during model training, the project taught us how to try out different solutions to tackle difficult problems.
What's next for Farm Atlas
First of all, we have to collect more amount of data to improve our model. We also want to incorporate other types of data too such as soil acidity and type since they might be factors that can impact the crop growing too. Also, our backend is relatively slow and so it takes some time to process the data. In the future, we wish to cut down the time it takes for the model to decide whether or not land can be used for farming.
Built With
- css
- flask
- google-cloud
- google-earth-engine
- html
- javascript
- machine-learning
- neural-networks
- python
- pytorch


Log in or sign up for Devpost to join the conversation.