-
-

Welcome
-
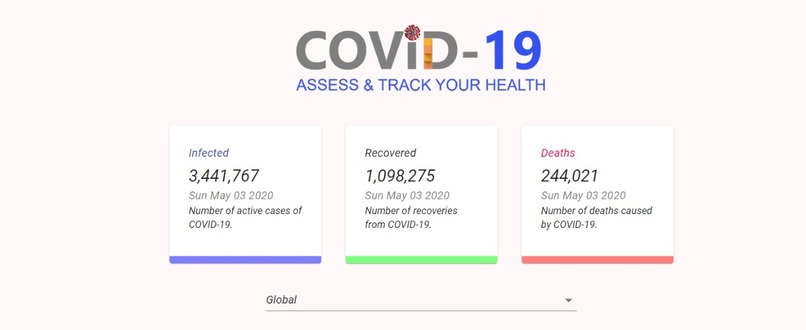
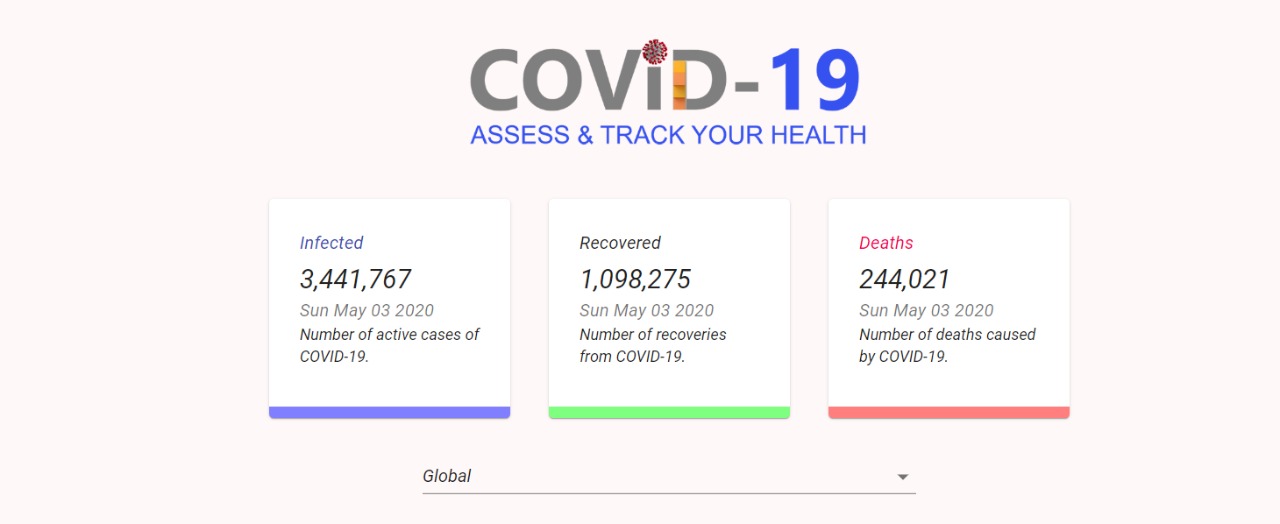
HomePage
-
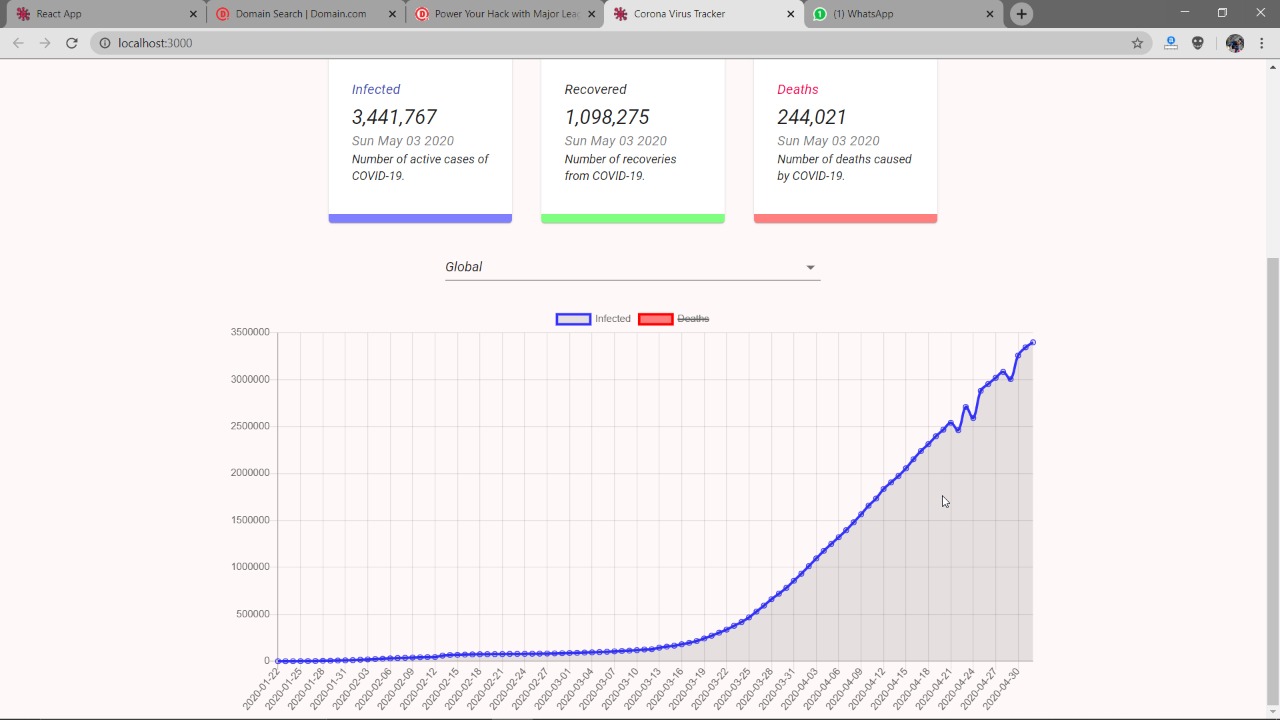
Global data
-
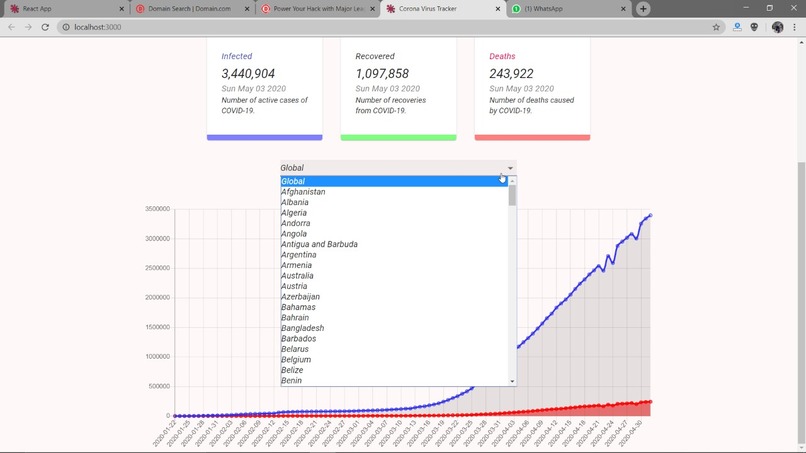
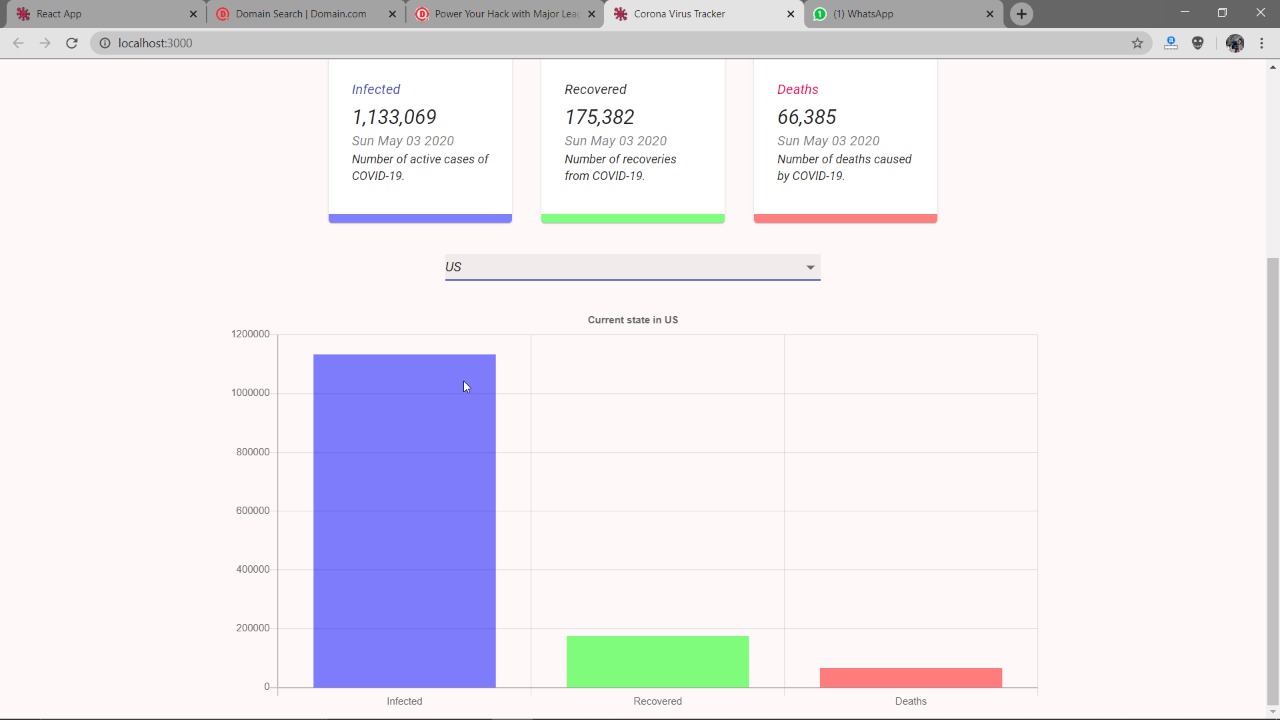
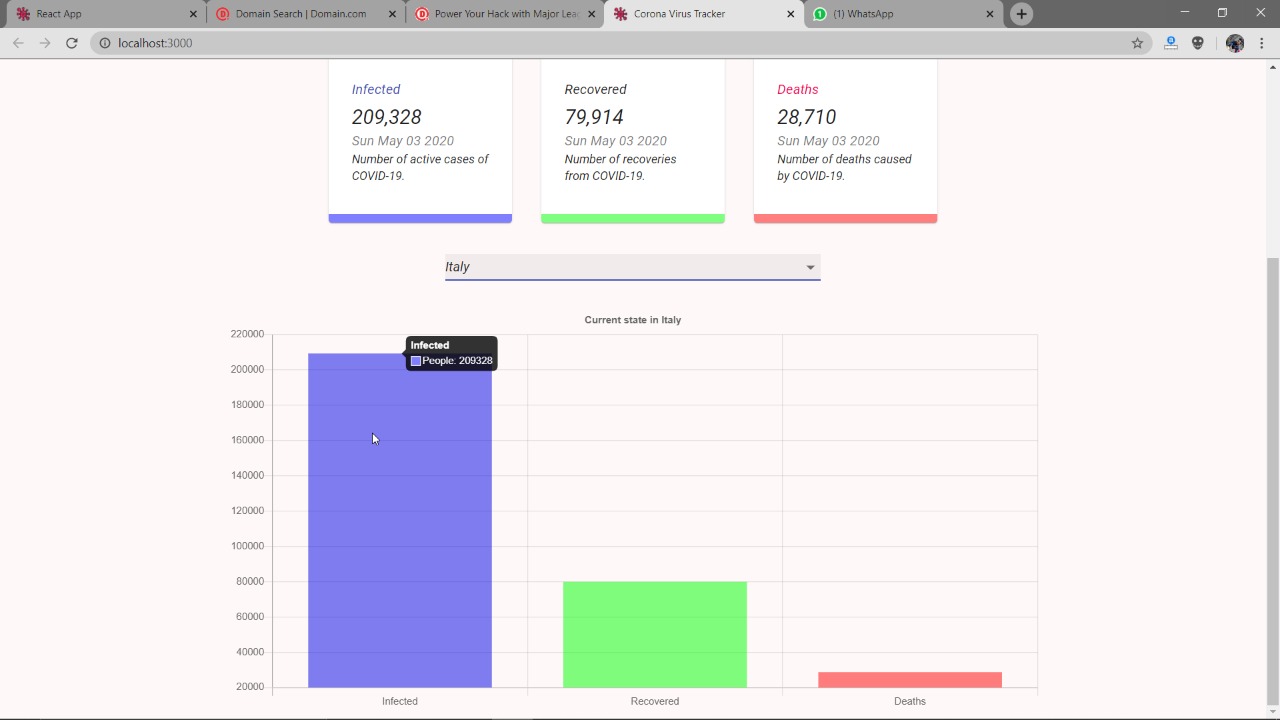
Dropdown to select a country
-

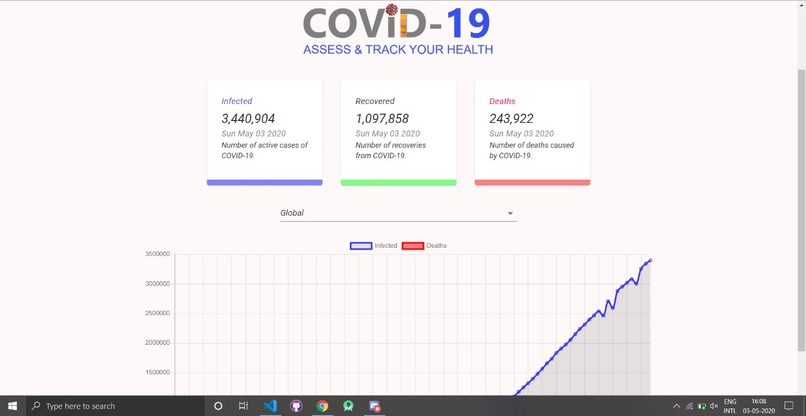
visualization
-
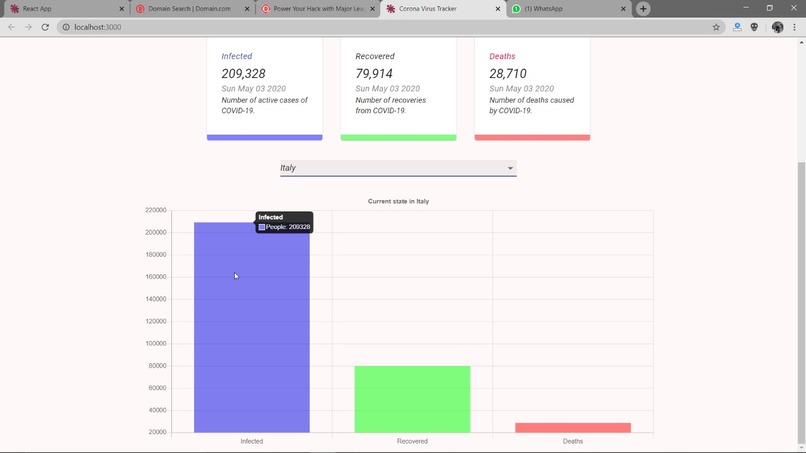
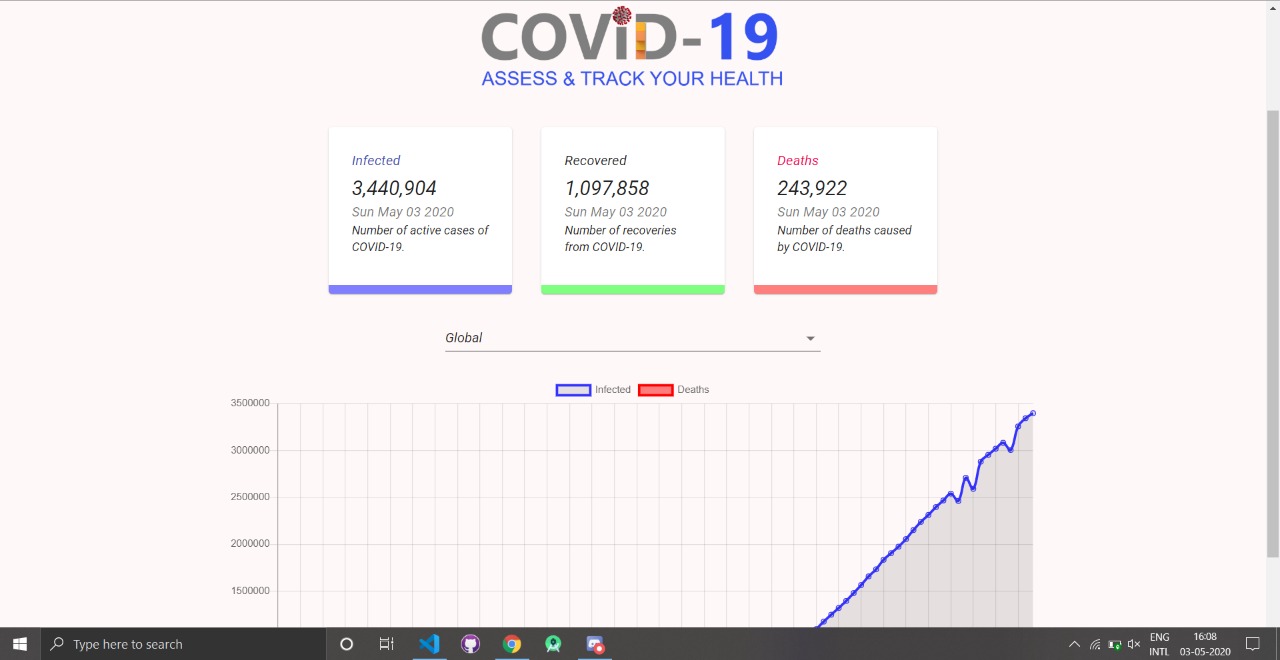
Responsive Visualisation
-
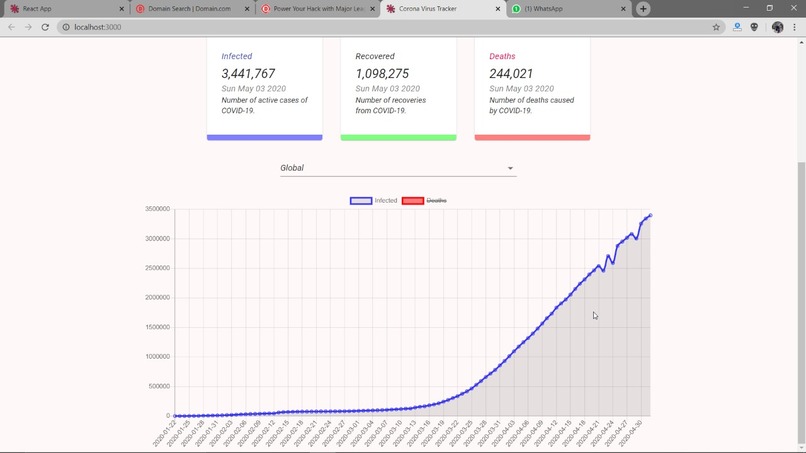
Graphical view about affected people
-
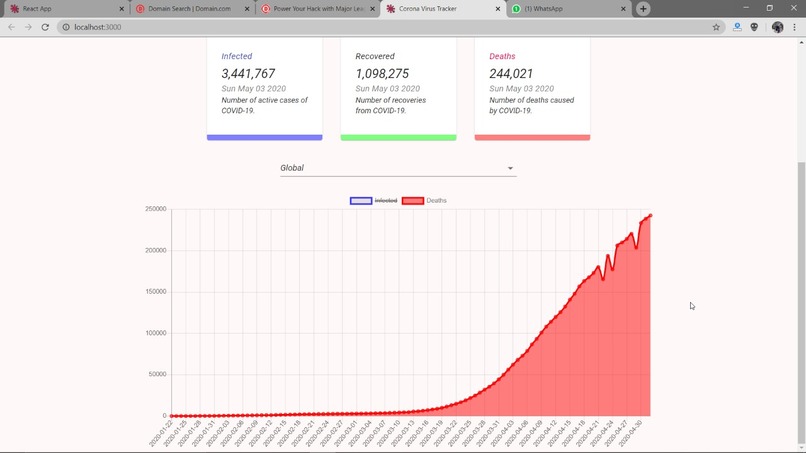
Graphical view about deaths


Inspiration
Nowadays, during this pandemic there was an extreme lack of resources such as education, Fun and Covid19 related, and we wanted an app that would allow all users to see where covid cases are most prevalent, how they can get their self well educated and how they’ll utilise their home Quarantine joyous.
What it does
Users can get the details about the number cases effected by covid, Infected people, Recovered and number of deaths caused by covid19. Users will get a beautiful visualization the whole number in all cases.
How we built it
API used: https://covid19.mathdro.id/api We built it with various languages such as : React, chartJS, Material UI and more.
Challenges we ran into
Being complete beginners to various technologies we had faced a lot of problems while figuring out every task. All of our team members are from different time zones so it's difficult to work together. Anyway thanks for the session on github it helped us a lot. Apart from that getting api to work, solving merge conflicts, Understanding the props and hooks in react became difficult to understand as we do not have any prior experience working with react.
Accomplishments that we’re proud of
We tried our best to merge three things at a place (Education,Fun and Updates about covid19) and it does'nt workout well. Even we are proud of our efforts in making the things happen. The website seems useful and able to launch. One of the main thing is almost we all are at the beginner level.
What we learned
We have learned how to structure the complex react web applications. Some use cases of MaterialUI were clearly understood and Building a multi-page web app using react router(thanks for the mentor help) Always build a scratch first and submit your project before the deadline.
What's next for Demo
Getting real users to use this website and share it, getting more countries onto the live covid19 section, getting real education and fun on board.
Built With
- api
- chartjs
- covidapi
- css3
- html5
- javascript
- materialui
- react


Log in or sign up for Devpost to join the conversation.