-

Bar Chart with maintenance cost
-

Pie Chart Asset Type and Number Of Repairs
-

Line Chart Number of Repairs categorized by manufacturer and asset type
-

Radar Chart
-

Data Prediction and Anamoly Detection
-

Instance Creation In Google Cloud
-

Database creation in pgAdmin
-

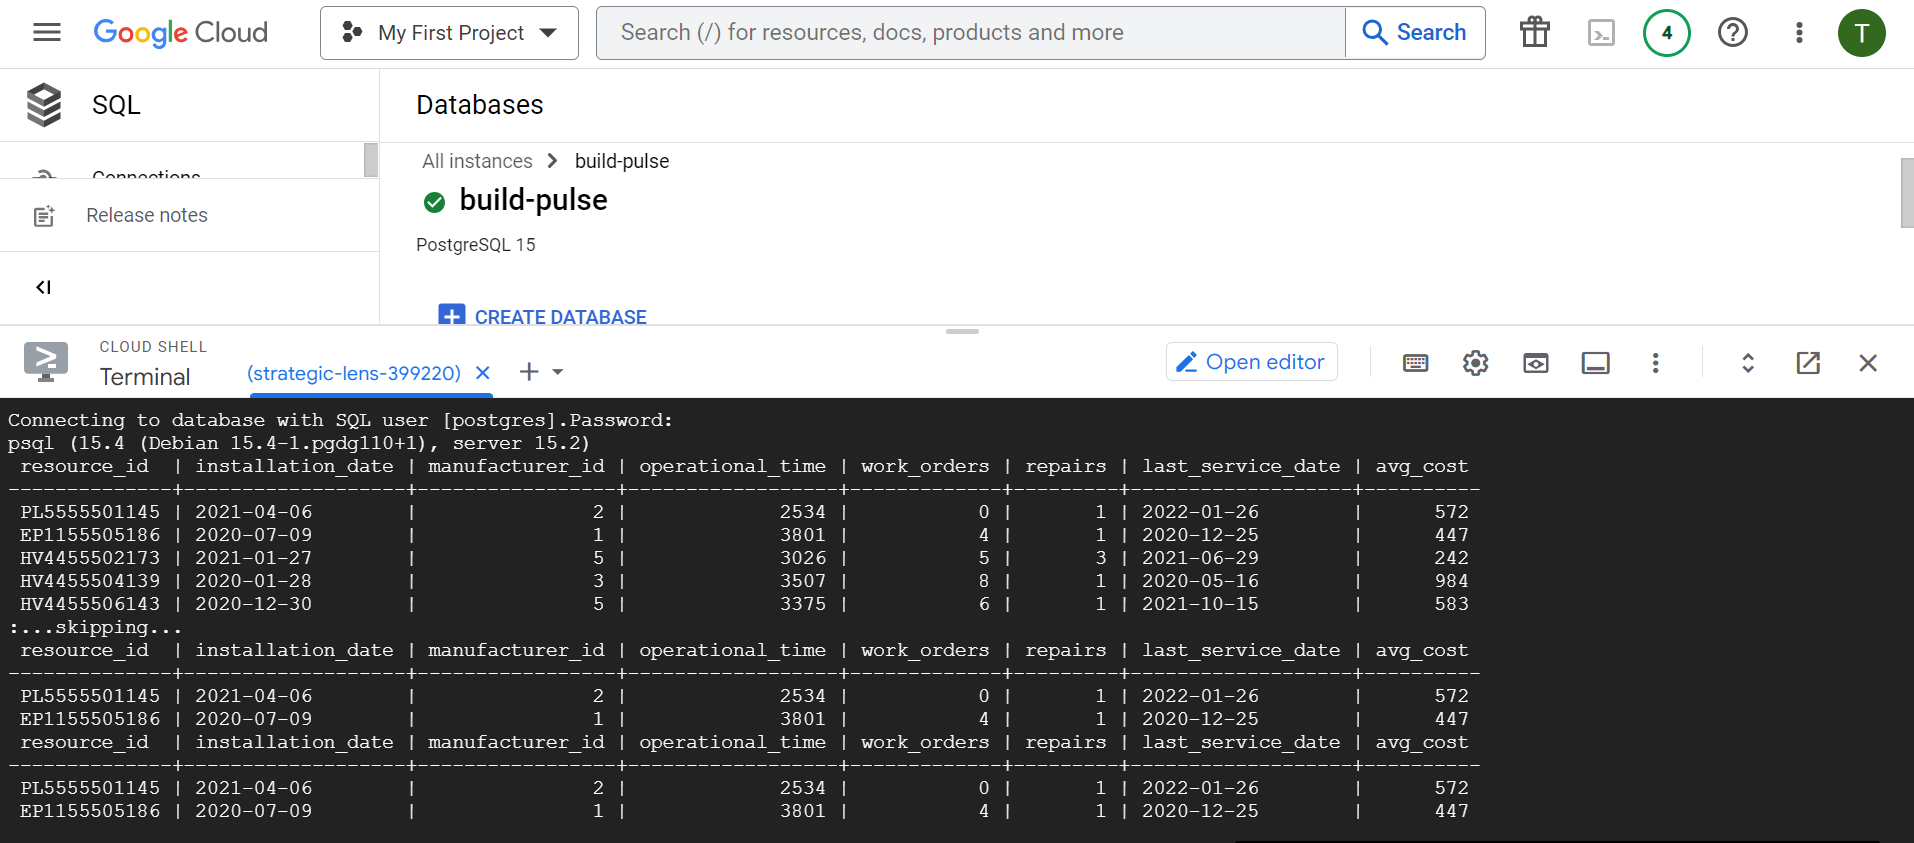
Database Query in Google shell
-

Code of Connecting to Cloud and Creation of API
-

Successful creation of API and retrieval of required data from Google Cloud


Build Pulse 🏢
Inspiration
🚀 Our goal is to provide property managers with top-end visualizations, allowing them to gain meaningful insights from their data.
What it does
Build Pulse is a property maintenance software with three powerful modules:
Visualization Module 📊
- Create customizable visualizations with ease.
- Choose from various chart types like pie, line, or bar charts.
- Select the time duration to analyze data.
- Filter by manufacturer or specific asset for tailored insights.
Prediction Analysis Module 🧠
- Leverage machine learning to predict future repairs.
- Input manufacturer, room, and floor data to get expected repair estimates.
Ticket Status Module 🎫
- Get real-time updates on all open maintenance tickets.
How we built it
🔧 We built Build Pulse using the following technologies:
- Frontend: React and Recharts for visualizations.
- Backend: Python for machine learning models.
- Database: Google Cloud PostgreSQL.
- Model Development: Jupyter Notebook.
Challenges we ran into
🤯 Integrating the frontend with the backend was a significant challenge.
Accomplishments that we're proud of
🎉 We're proud of successfully completing the entire hackathon as a team. It was the first in-person hackathon experience for all of us, and it pushed us to our limits.
What we learned
🧠 Throughout this project, we learned the importance of teamwork and collaboration. We also gained valuable experience with new technologies, including Google Cloud and Recharts.
What's next for Build Pulse
🚀 The journey doesn't end here! We plan to enhance Build Pulse further by adding features like data export downloading options, and advanced predictive analytics.

Log in or sign up for Devpost to join the conversation.