-
Sample Deterioration Curve

Inspiration
This was a very eye-opening problem that shed light onto an issue that wasn't widely known.
What it does
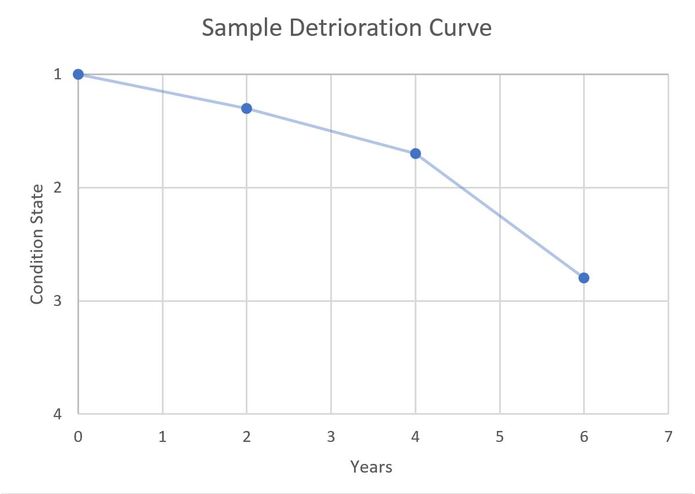
Our project analyzes historical inspection data of all bridge elements in Illinois.
How we built it
We created functions to clean and sort the IDOT-provided data in Python and implemented the data visualization in Excel. We imported the inspection data as a data frame in Python where we created a dictionary containing sub-data frames organized by bridge element and condition. We created individual functions to clean the data to be able to use for statistical models.
Challenges we ran into
Understanding the 804,342 rows of bridge data and identifying the essential data. Reducing time complexity of cleaning and sorting function due to magnitude of data set.
Accomplishments that we're proud of
Starting from no background knowledge of the problem and ending up with a working model based on extracted data.
What we learned
We learned how to manage large data sets and create probability functions based on historical data. We also learned about deterioration curves and how to model them.
What's next for Bridge Deterioration Model
Implementing data for repairs and bad inspection data and creating a more complex stochastic model to improve accuracy.
Log in or sign up for Devpost to join the conversation.