-
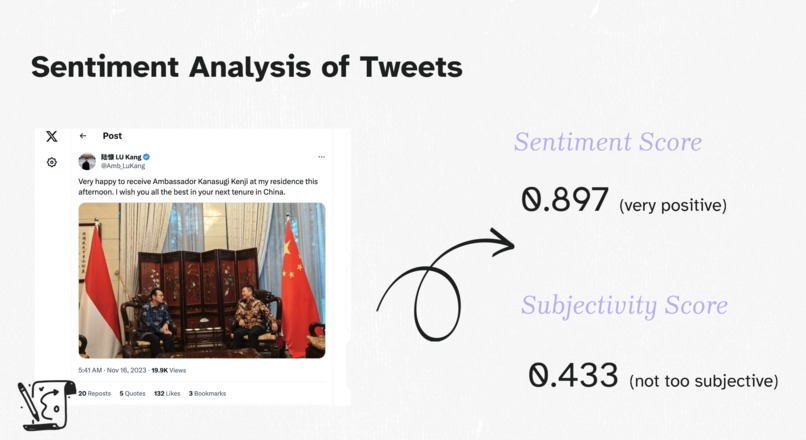
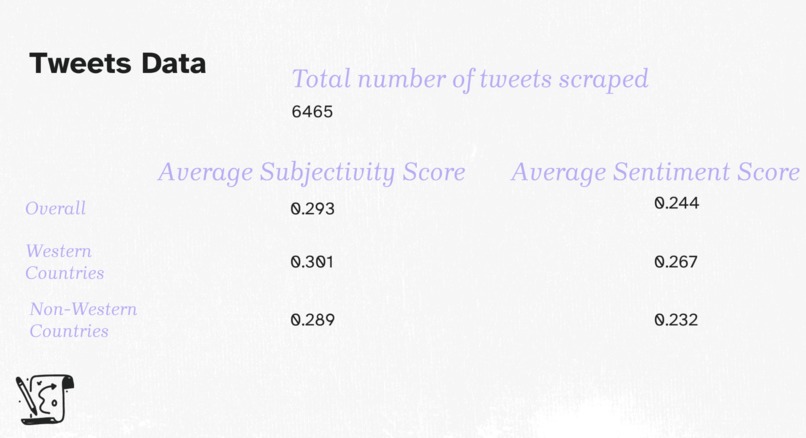
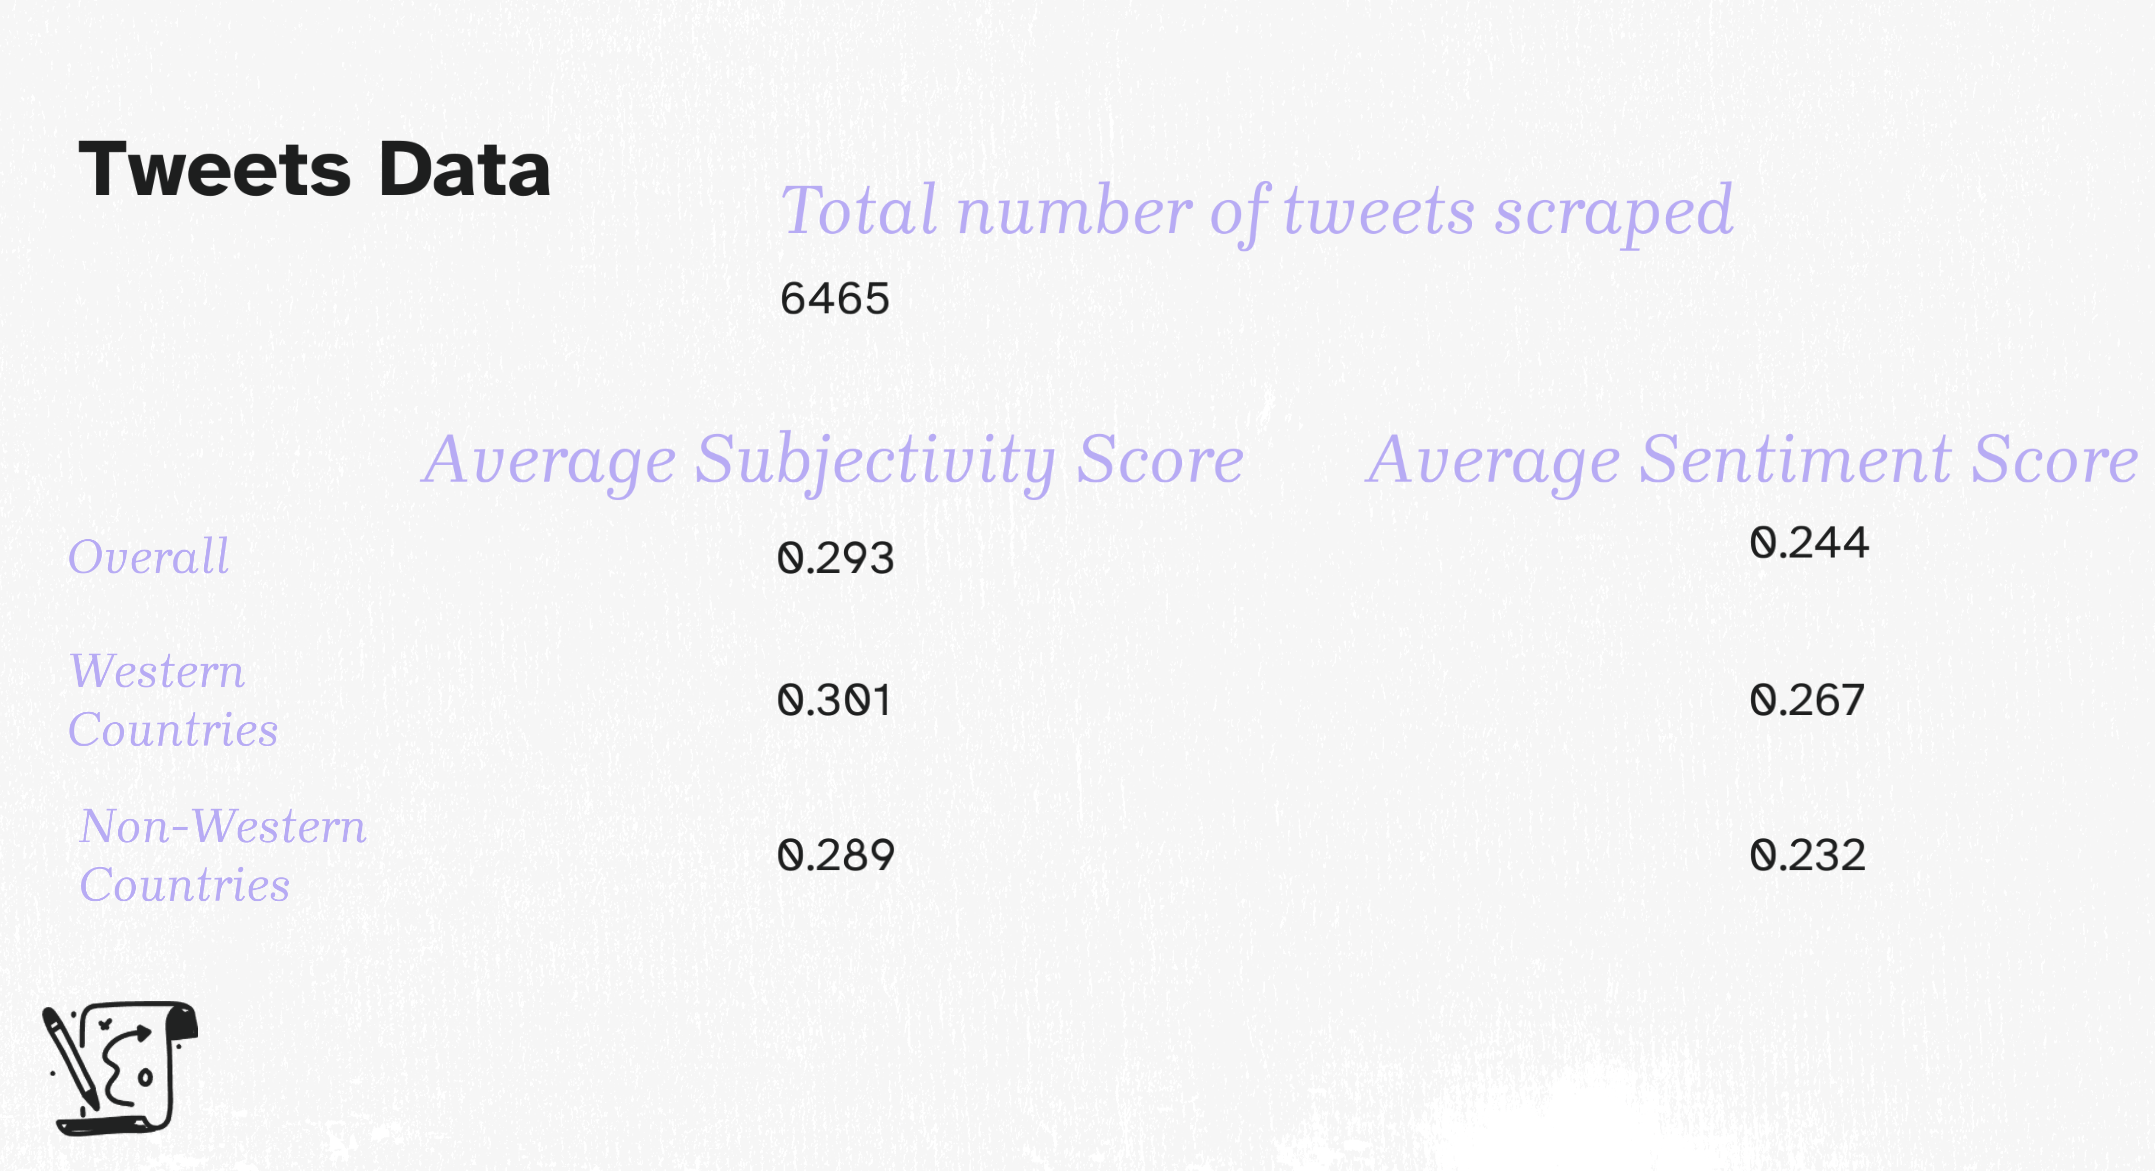
Sentiment analysis of the scraped tweets
-
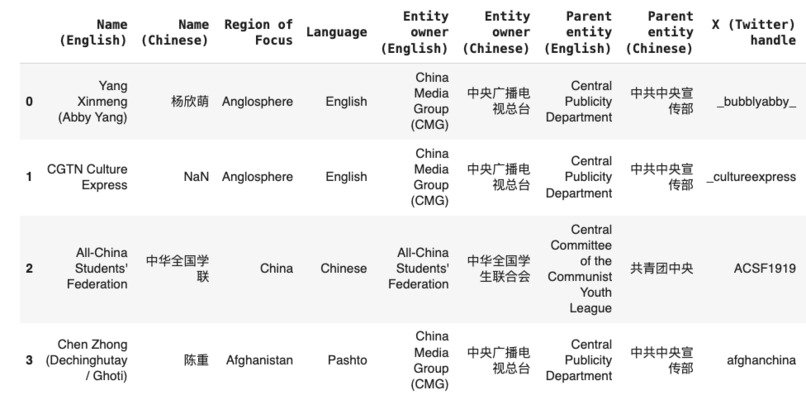
Tweets scraped from 573 accounts that were used in the analysis
-
-
-
-


Inspiration
Given the geopolitical situation in the world today and the growing East-West divide, we wanted to analyze and compare China's covert foreign influence and interference operations in 2 different contexts: what these operations look like when their targets are Western countries, and what these operations look like when their targets are non-Western countries.
What it does
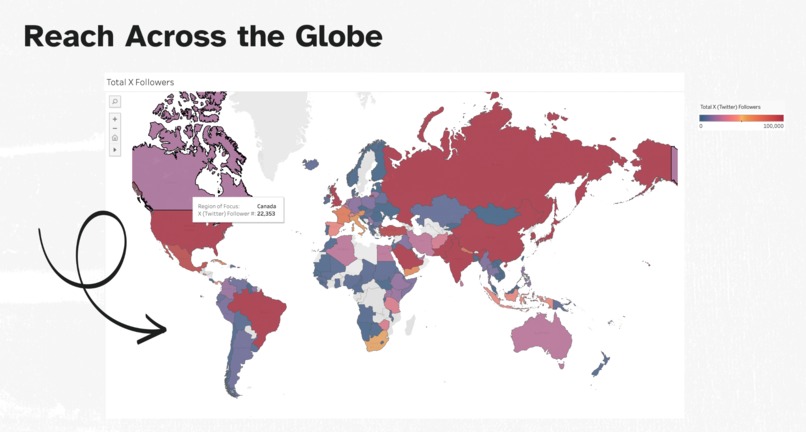
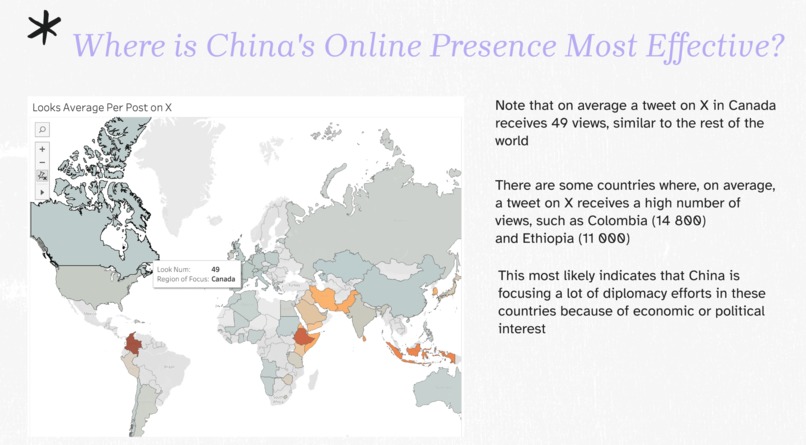
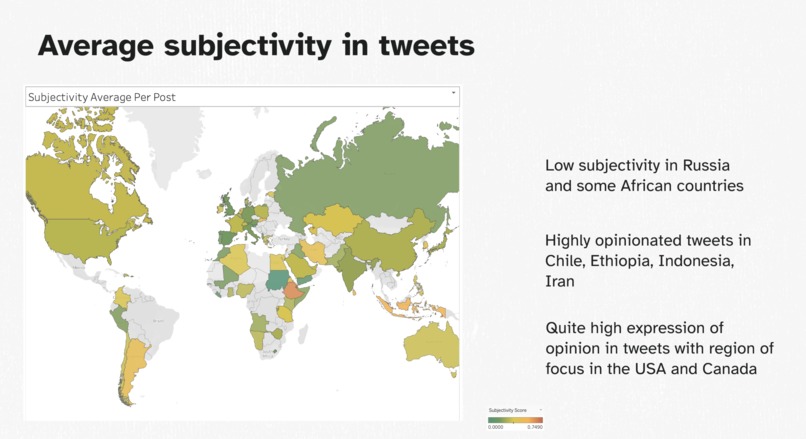
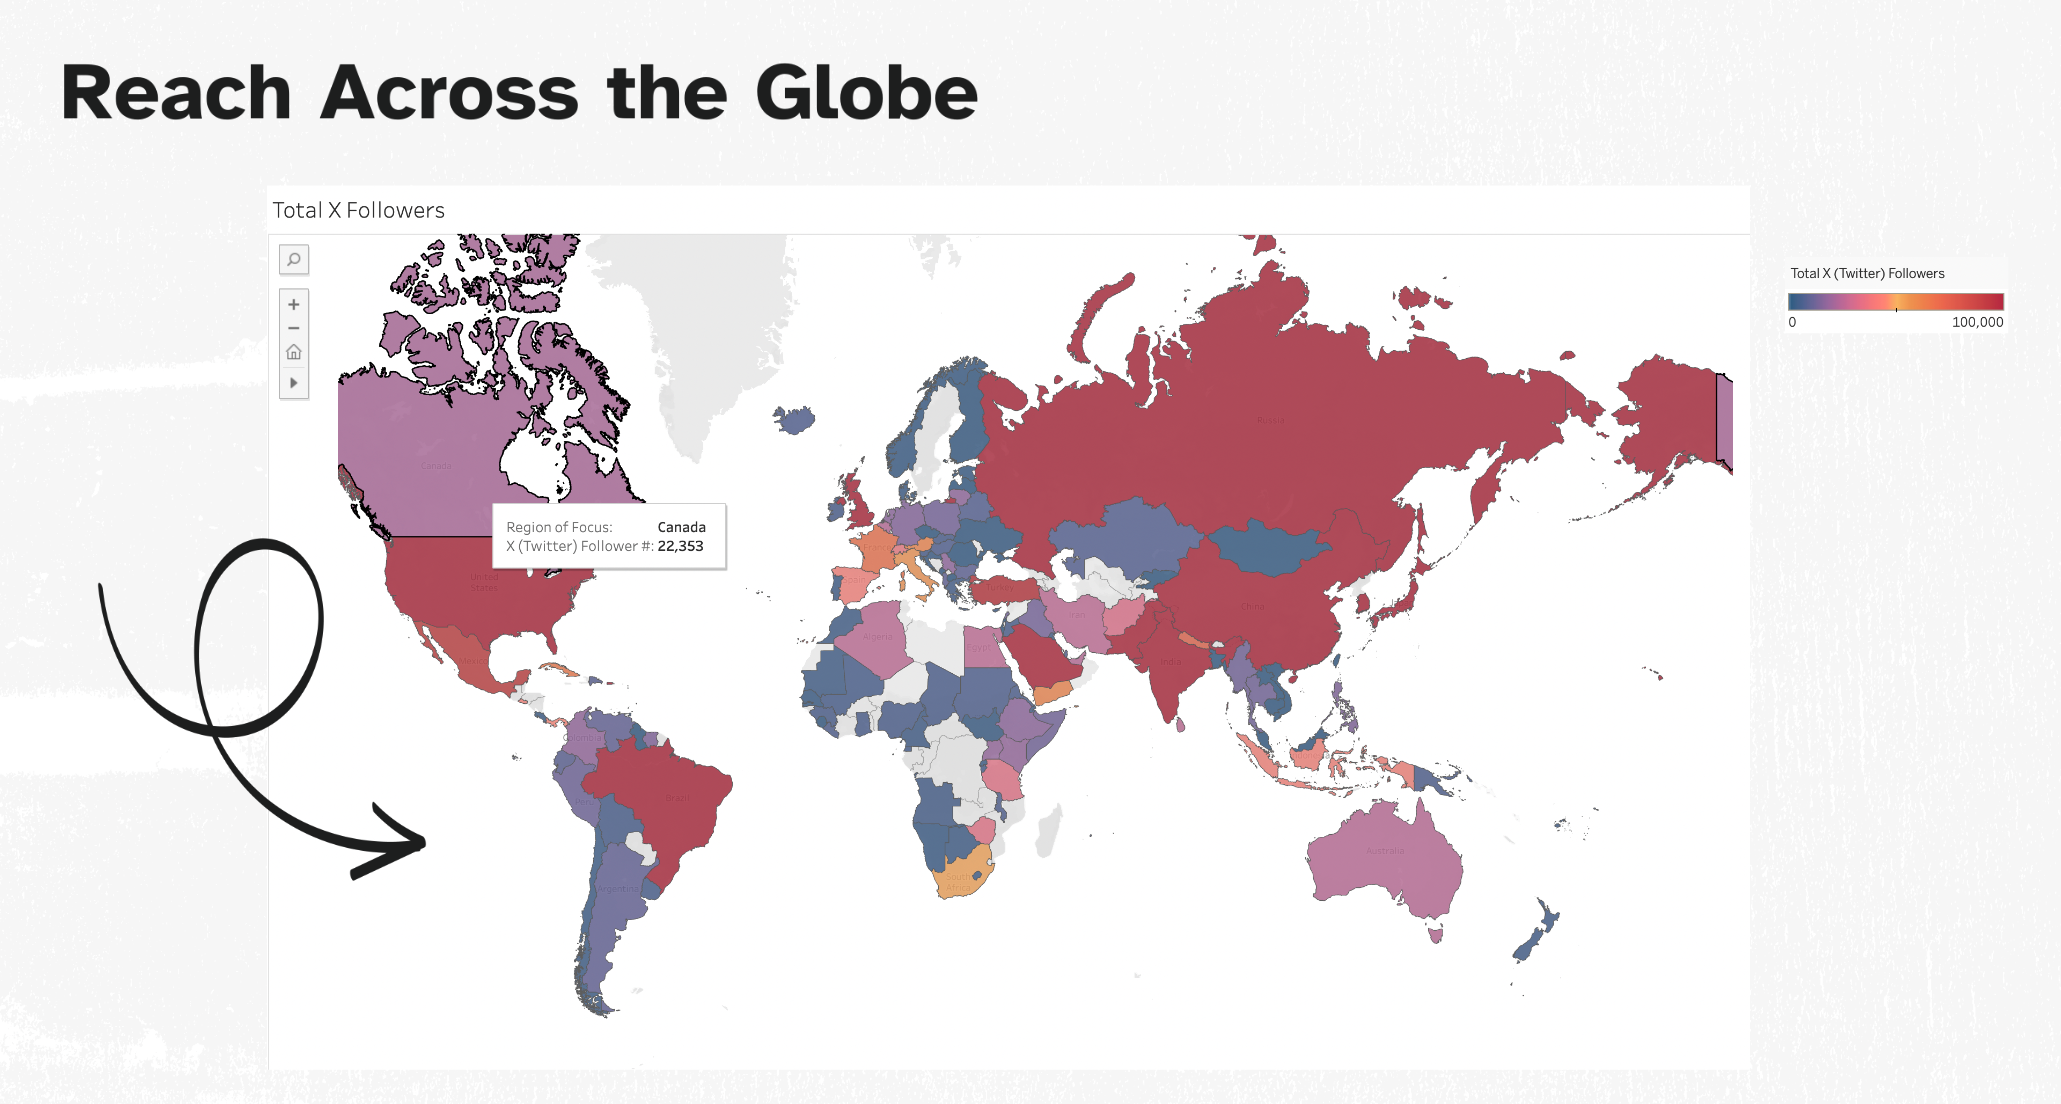
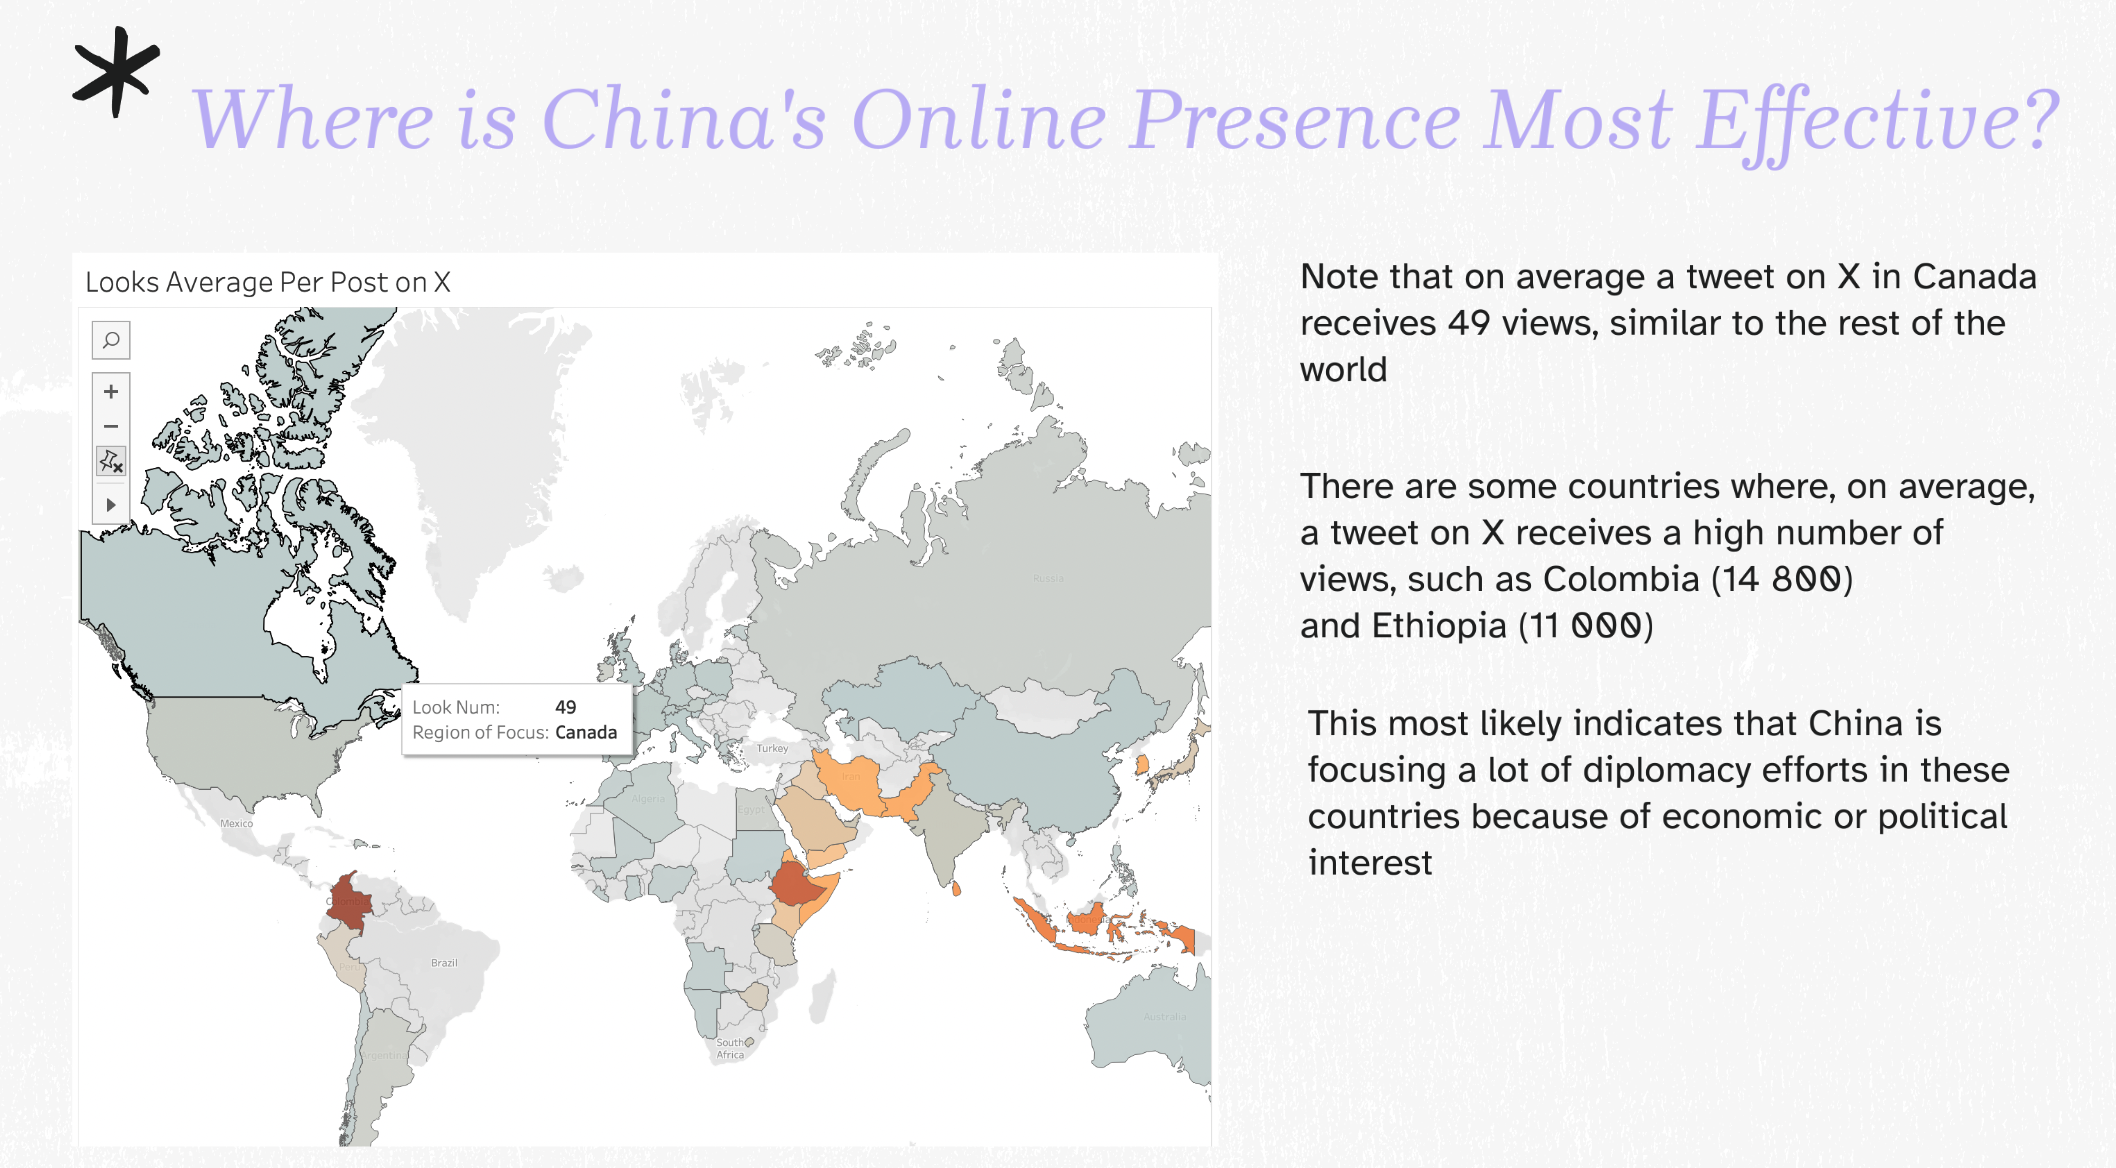
Our project is a series of visualizations, both interactive and non-interactive, that seek to paint a picture of how Chinese state media actors use social media (primarily Twitter) to execute foreign influence and interference operations in both Western and non-Western countries.
How we built it
We built these visuals using 2 main datasets: the one we were given and one containing tweets that we scraped. We cleaned these datasets using the Google Colaboratory notebook linked on this page, where we also used NLTK's Vader library to analyze the tweets and assign them the relevant metrics. Then, we used both Colaboratory and Tableau to create the visuals. These were ultimately displayed in the Prezi presentation that is also linked on this page.
Challenges we ran into
The biggest challenge we ran into was difficulty scraping tweets from Twitter, as we were unfortunately only able to scrape tweets from about 150 of the 573 accounts that we wanted to access. Although this still amounted to about 6500 tweets that we were able to derive analyses from, a future improvement would be to gain access to a wider range of tweets from a wider range of accounts.

Log in or sign up for Devpost to join the conversation.