-
-
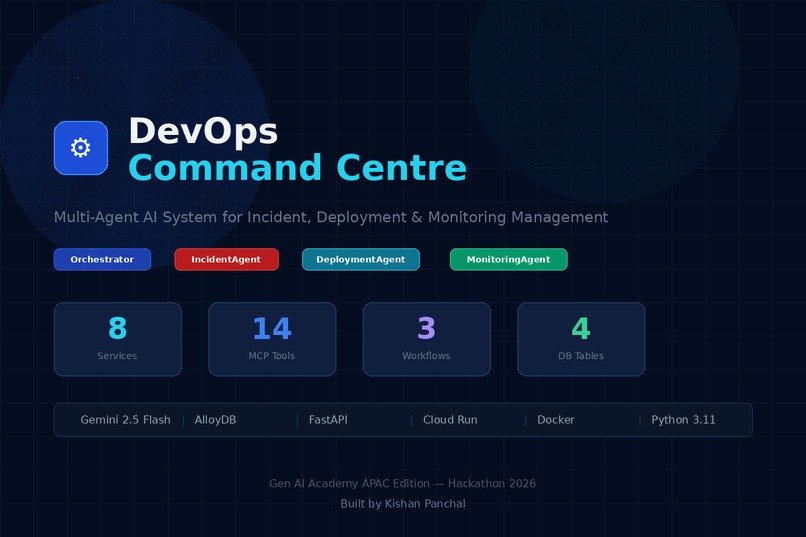
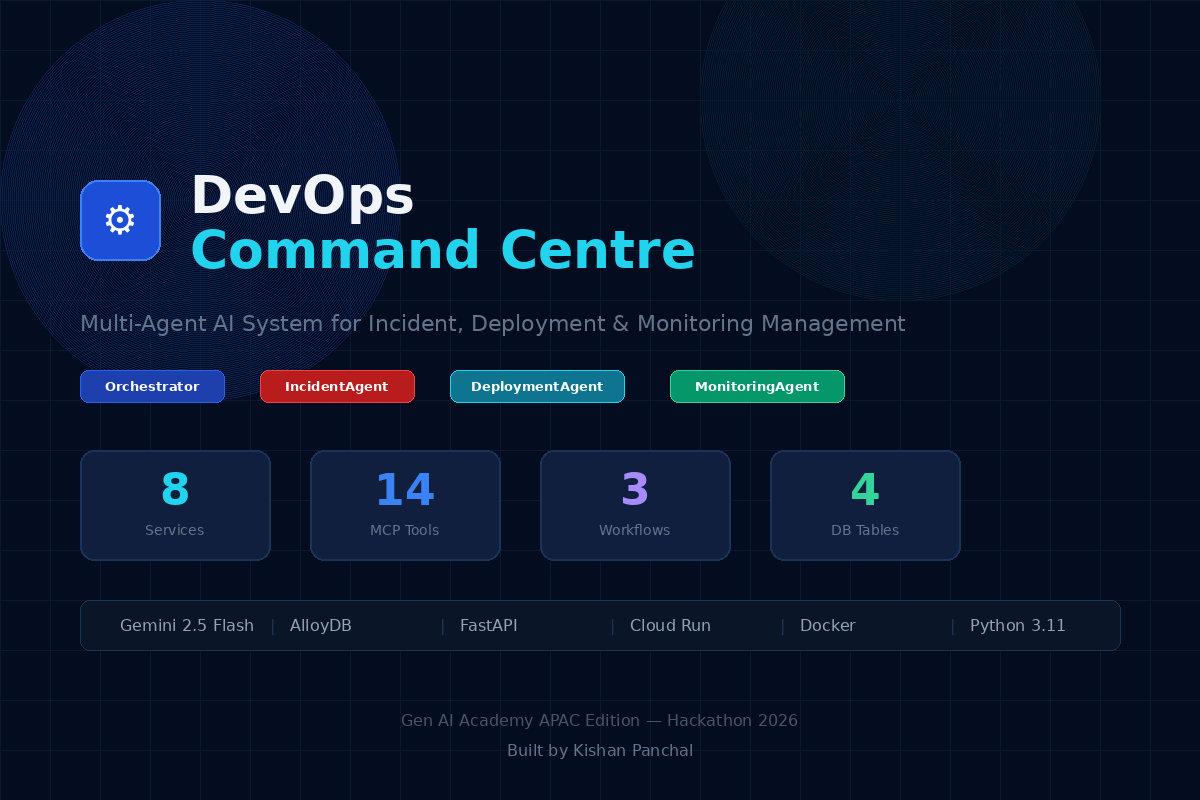
app screenshot
-
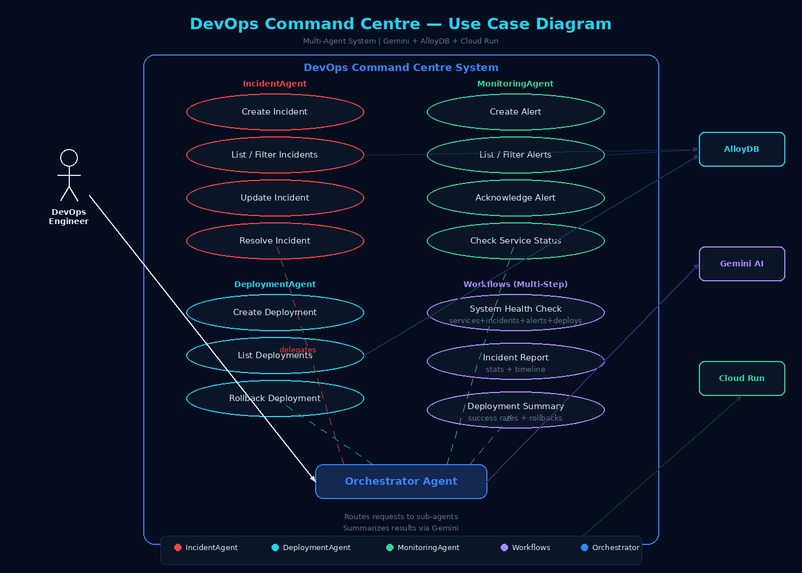
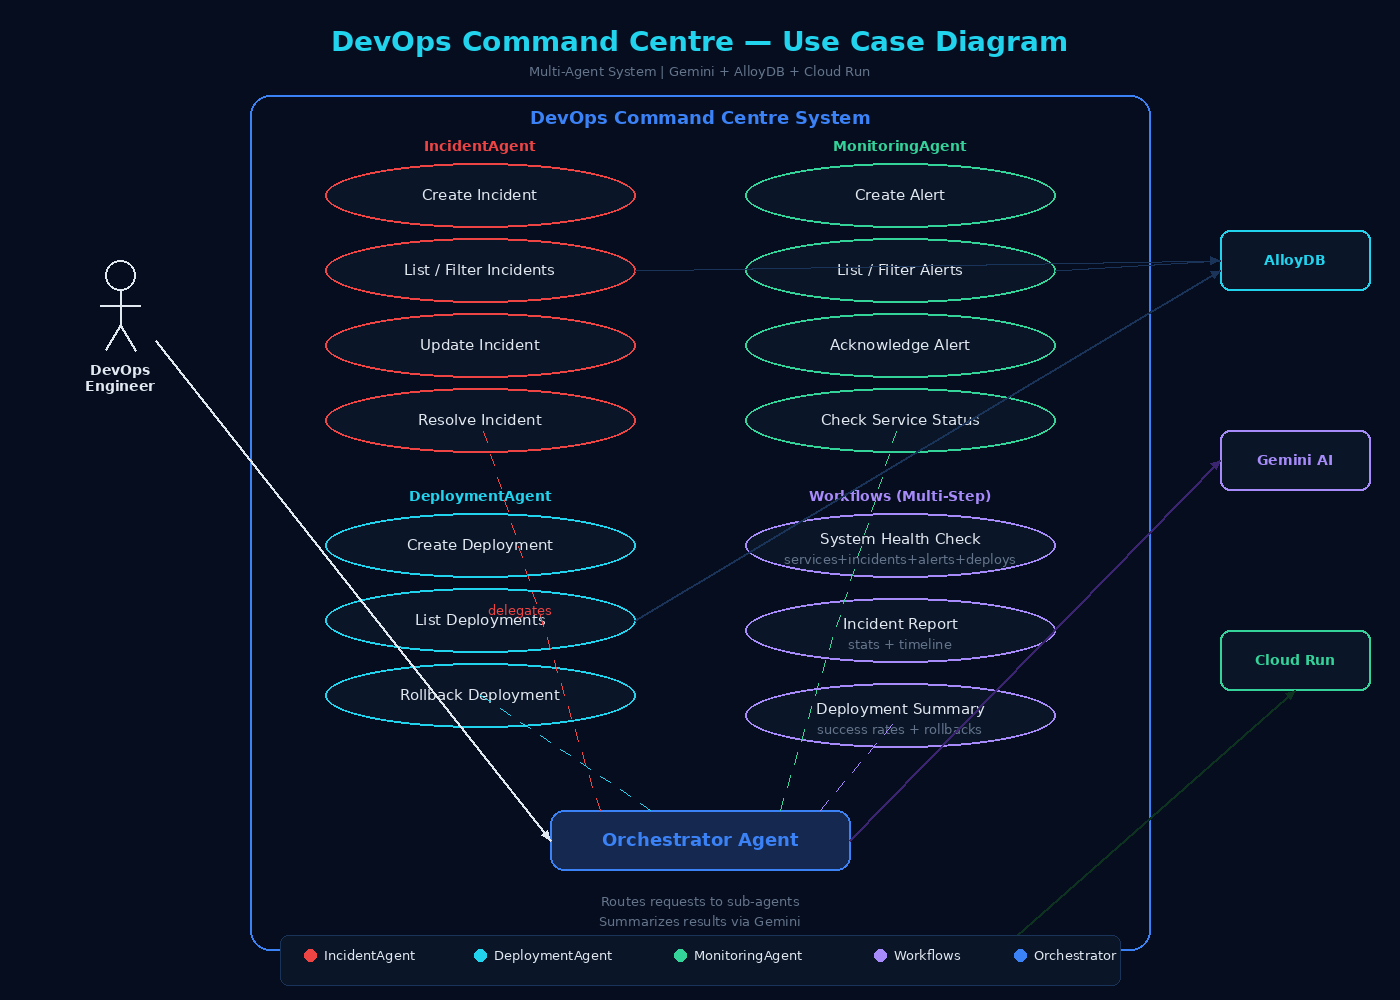
use case diagram
Inspiration
As a DevOps professional who deal with incident management, deployment tracking, and monitoring daily — often switching between 3-4 different tools like PagerDuty, Jenkins, Grafana, and Slack during a single outage. The context switching alone costs precious minutes when systems are down. When I saw the hackathon problem statement — "Build a multi-agent AI system that helps users manage tasks, schedules, and information by interacting with multiple tools and data sources" — it immediately mapped to this real-world pain point. What if an on-call engineer could simply type "system health check" and instantly see all services, open incidents, firing alerts, and recent deployments in one unified response? That's what DevOps Command Centre does.
What it does
DevOps Command Centre is a multi-agent AI system with 4 agents, 14 MCP-pattern tools, and 3 multi-step workflows:
Orchestrator Agent (Gemini 2.5 Flash) — the primary agent that analyzes user intent and delegates to specialized sub-agents IncidentAgent — creates, tracks, escalates, and resolves incidents with severity levels (critical/high/medium/low). Automatically marks affected services as degraded and restores them when incidents are resolved DeploymentAgent — logs deployments with version tracking, manages staging/production environments, and performs one-command rollbacks by automatically finding the previous version MonitoringAgent — creates and acknowledges alerts, monitors health status across 8 microservices
The most powerful feature is multi-agent coordination. When you say "Create incident and alert for database timeout on order-service", the Orchestrator triggers BOTH IncidentAgent and MonitoringAgent simultaneously — creating an incident record AND a firing alert in one coordinated action. Three multi-step workflows aggregate data across all agents:
system_health_check — queries all 4 database tables (services + incidents + alerts + deployments) and returns a unified infrastructure status incident_report — aggregates all incidents with severity breakdown and status statistics deployment_summary — analyzes deployment history with success rates, rollback counts, and environment breakdown
Everything is exposed as both a chat interface (natural language) and REST API (8 programmatic endpoints), deployed serverlessly on Cloud Run.
How we built it
Architecture decisions:
Separated the Orchestrator's reasoning (Gemini 2.5 Flash) from tool execution (Python functions) following the MCP pattern — the AI decides WHAT to do, the tools DO it Each sub-agent has its own set of standardized MCP tools with consistent input/output schemas The Orchestrator returns a JSON array of tool calls, enabling multi-agent coordination in a single request After all tools execute, a second Gemini call summarizes the raw results into a human-friendly DevOps-style response
Tech stack:
AI: Vertex AI Gemini 2.5 Flash with system instructions for agent routing Database: AlloyDB for PostgreSQL with 4 tables — services (8 microservices), incidents, deployments, alerts Backend: Python 3.11 + FastAPI with async endpoints, SQLAlchemy ORM, pg8000 driver Connector: google-cloud-alloydb-connector for secure IAM-based private connections Frontend: Separate index.html with dark blue UI, plain JavaScript using XMLHttpRequest and addEventListener for maximum compatibility Deployment: Docker container (python:3.11-slim) on Google Cloud Run with VPC private service access to AlloyDB Server: Gunicorn with Uvicorn ASGI workers for production performance
Data flow:
User types natural language in the chat UI or calls the /chat API Orchestrator (Gemini) analyzes intent and generates a JSON array of tool calls with agent assignments Each tool call is executed against AlloyDB — creating/reading/updating records For multi-agent requests, multiple tools from different agents run in sequence All results are collected and Gemini generates a concise bullet-point summary Response includes which agents were used and which tools were called — full transparency
Challenges we ran into
HTML inside Python strings broke JavaScript — Initially embedded the entire frontend HTML inside a Python triple-quoted string. JavaScript's template literals (${}), backticks, and escape characters were being mangled by Python's string parser. Buttons didn't work, example prompts weren't clickable, and Send did nothing. Fixed by separating index.html as a standalone file and rewriting all JS with plain var, function(){}, and XMLHttpRequest — zero ambiguity. AlloyDB VPC networking — AlloyDB only accepts private IP connections. The project already had existing VPC peering ranges (sql, google-managed-services-default) which conflicted with creating new ones. Had to detect existing ranges, use --allocated-ip-range-name to explicitly specify which range the cluster should use, and configure Cloud Run with --vpc-egress=all-traffic. Gemini model availability — gemini-2.0-flash-001 returned a 404 "model not found" error in our project. Switched to gemini-2.5-flash which worked immediately. system_instruction API mismatch — The Vertex AI SDK requires system_instruction to be passed to GenerativeModel() at initialization, NOT to generate_content() at call time. This caused a TypeError that only appeared in Cloud Run logs — the UI just showed nothing. Added debug print statements to catch these issues. IAM permission layers — Cloud Run's compute service account needed roles/alloydb.admin (not just roles/alloydb.client) because the AlloyDB Python connector performs a Metadata Exchange that requires admin-level permissions for certificate generation.
Accomplishments that we're proud of
True multi-agent coordination — not just function calling, but an Orchestrator that intelligently routes multi-part requests to multiple sub-agents. "Create incident and alert for auth-service" triggers 2 different agents with 2 different tools in one request. 14 working MCP-pattern tools — each with standardized interfaces, proper error handling, and database-backed execution. Tools have real side effects (creating incidents marks services as degraded, resolving incidents restores service health). 3 multi-step workflows — system_health_check alone queries 4 different tables and aggregates the results into a unified infrastructure overview. This demonstrates real workflow orchestration, not just simple CRUD. Production-quality deployment — Docker container on Cloud Run with VPC private connectivity, IAM-based authentication, auto-scaling from 0 to 3 instances, and structured logging. Dual interface — both a polished chat UI for interactive use AND a full REST API with 8 endpoints for programmatic access. You can manage your infrastructure from a browser or from curl. Live dashboard — real-time stats (services count, open incidents, firing alerts, deployments) that update after every agent action.
What we learned
Multi-agent architecture patterns — how to design an Orchestrator that delegates to specialized agents based on intent analysis, and how to handle requests that need multiple agents MCP (Model Context Protocol) tool design — standardized tool interfaces with consistent input/output schemas that make agents modular and extensible AlloyDB + Vertex AI integration — connecting a fully managed PostgreSQL database to Gemini models through Cloud Run's VPC networking Prompt engineering for structured output — getting Gemini to reliably return JSON arrays of tool calls with correct parameter mapping requires very specific prompt formatting Cloud Run deployment patterns — VPC egress configuration, IAM role chains, environment variable management, and the importance of separating static files from Python code Debugging serverless applications — Cloud Run logs, curl testing, and adding print statements are essential since you can't SSH into the container
What's next for DevOps Command Centre
Real integrations via MCP servers — connect to actual Prometheus, Grafana, PagerDuty, and Jira through remote MCP servers instead of simulated tools Long-term memory — integrate Vertex AI Memory Bank so the agent remembers past incidents, preferred escalation paths, and team preferences across sessions A2A Protocol — implement Google's Agent-to-Agent protocol for dynamic agent discovery, allowing new specialist agents to register themselves Real CI/CD pipeline integration — connect DeploymentAgent to GitHub Actions and Cloud Build for actual deployment triggers Anomaly detection — use AlloyDB's ML integration to detect patterns in incident/alert data and proactively create incidents before users report them Slack/Teams integration — expose the Orchestrator as a Slack bot so engineers can manage infrastructure directly from their communication tools RBAC (Role-Based Access Control) — add row-level security in AlloyDB so different teams only see their own services' incidents and alerts
Built With
- alloydb
- css
- docker
- fastapi
- gemini-2.5-flash
- google-cloud-run
- gunicorn
- html
- postgresql
- python
- sqlalchemy
- uvicorn
- vertex-ai

Log in or sign up for Devpost to join the conversation.